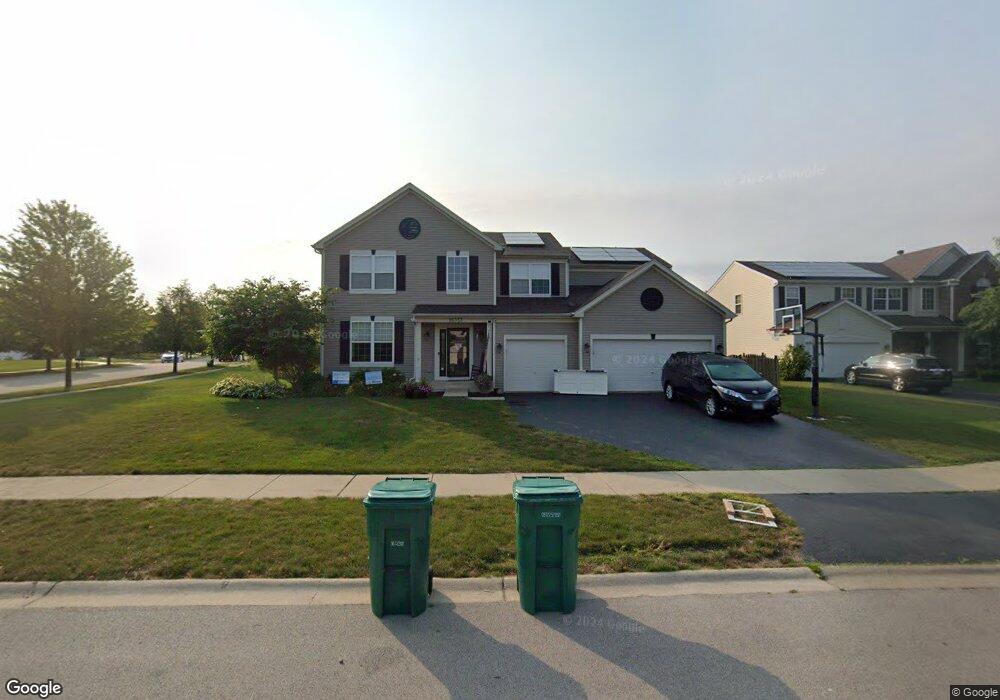
16353 W Caraway Ct Unit 2 Lockport, IL 60441
Estimated Value: $500,000 - $566,000
--
Bed
--
Bath
3,199
Sq Ft
$164/Sq Ft
Est. Value
About This Home
This home is located at 16353 W Caraway Ct Unit 2, Lockport, IL 60441 and is currently estimated at $523,567, approximately $163 per square foot. 16353 W Caraway Ct Unit 2 is a home located in Will County with nearby schools including William J. Butler, Hadley Middle School, and Homer Jr High School.
Ownership History
Date
Name
Owned For
Owner Type
Purchase Details
Closed on
Apr 25, 2025
Sold by
York April L and Blaesing Greg
Bought by
Blaesing Greg and Blaesing April L
Current Estimated Value
Home Financials for this Owner
Home Financials are based on the most recent Mortgage that was taken out on this home.
Original Mortgage
$427,500
Interest Rate
7.62%
Mortgage Type
New Conventional
Purchase Details
Closed on
Sep 15, 2011
Sold by
Odonnell Kevin J and Odonnell Tracy L
Bought by
Blaesing Greg and York April L
Home Financials for this Owner
Home Financials are based on the most recent Mortgage that was taken out on this home.
Original Mortgage
$208,000
Interest Rate
4.12%
Mortgage Type
New Conventional
Purchase Details
Closed on
Mar 10, 2004
Sold by
The Ryland Group Inc
Bought by
Odonnell Kevin J and Odonnell Tracy L
Home Financials for this Owner
Home Financials are based on the most recent Mortgage that was taken out on this home.
Original Mortgage
$229,000
Interest Rate
5.65%
Mortgage Type
Purchase Money Mortgage
Create a Home Valuation Report for This Property
The Home Valuation Report is an in-depth analysis detailing your home's value as well as a comparison with similar homes in the area
Home Values in the Area
Average Home Value in this Area
Purchase History
| Date | Buyer | Sale Price | Title Company |
|---|---|---|---|
| Blaesing Greg | -- | Wfg Lender Services | |
| Blaesing Greg | $260,000 | Saturn Title Llc | |
| Odonnell Kevin J | $316,000 | -- |
Source: Public Records
Mortgage History
| Date | Status | Borrower | Loan Amount |
|---|---|---|---|
| Previous Owner | Blaesing Greg | $427,500 | |
| Previous Owner | Blaesing Greg | $208,000 | |
| Previous Owner | Odonnell Kevin J | $229,000 |
Source: Public Records
Tax History Compared to Growth
Tax History
| Year | Tax Paid | Tax Assessment Tax Assessment Total Assessment is a certain percentage of the fair market value that is determined by local assessors to be the total taxable value of land and additions on the property. | Land | Improvement |
|---|---|---|---|---|
| 2024 | $11,766 | $142,355 | $28,592 | $113,763 |
| 2023 | $11,766 | $129,038 | $25,917 | $103,121 |
| 2022 | $11,295 | $130,115 | $24,199 | $105,916 |
| 2021 | $11,157 | $123,274 | $22,927 | $100,347 |
| 2020 | $11,284 | $118,738 | $22,083 | $96,655 |
| 2019 | $10,701 | $114,226 | $21,244 | $92,982 |
| 2018 | $10,212 | $107,633 | $15,717 | $91,916 |
| 2017 | $10,056 | $104,620 | $15,277 | $89,343 |
| 2016 | $9,839 | $101,131 | $14,768 | $86,363 |
| 2015 | $9,378 | $97,335 | $14,214 | $83,121 |
| 2014 | $9,378 | $93,277 | $13,920 | $79,357 |
| 2013 | $9,378 | $93,277 | $13,920 | $79,357 |
Source: Public Records
Map
Nearby Homes
- 17825 S Alta Dr
- 16335 Cagwin Dr Unit 2
- 16146 W Oak Ave
- 17612 S Gilbert Dr
- 17542 Gilbert Dr Unit 404D
- 17526 S Gilbert Dr Unit 302D
- 16556 Willow Walk Dr
- 15959 Prairie View Ct Unit T6
- 15949 Prairie View Ct Unit T5
- 17437 Yakima Dr
- The Lauren Plan at Prairie Ridge North
- The Grace Plan at Prairie Ridge North
- The Katherine Front Porch Elevation Plan at Prairie Ridge North
- 16125-45 Bruce Rd
- 16623 W Natoma Dr Unit 16623
- 17326 Long Bow Dr
- The Grace Plan at Prairie Ridge of New Lenox
- The Lauren Plan at Prairie Ridge of New Lenox
- The Katherine Front Porch Elevation Plan at Prairie Ridge of New Lenox
- 17302 Long Bow Dr
- 16353 W Caraway Ct
- 16357 Caraway Ct
- 17856 Alta Dr
- 17859 Alta Dr Unit 2
- 17857 Alta Dr Unit 2
- 16361 Caraway Ct
- 16354 Caraway Ct Unit 2
- 17854 S Alta Dr
- 17861 Alta Dr Unit 2
- 17855 Alta Dr Unit 2
- 16358 Caraway Ct
- 16365 Caraway Ct
- 17852 Alta Dr
- 16362 Caraway Ct Unit 2
- 17853 Alta Dr Unit 2
- 17863 Alta Dr
- 16366 Caraway Ct Unit 2
- 17864 Alta Dr Unit 2
- 17864 S Alta Dr
- 17750 Willard Ln Unit 2