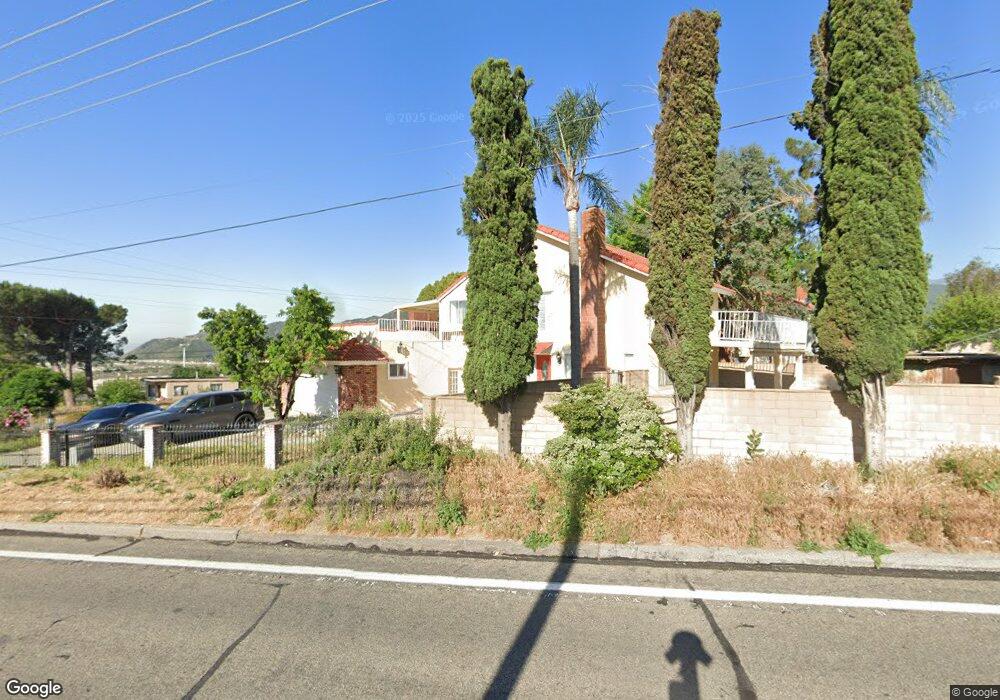
1636 Devore Rd San Bernardino, CA 92407
Estimated Value: $543,000 - $717,000
3
Beds
3
Baths
2,160
Sq Ft
$296/Sq Ft
Est. Value
About This Home
This home is located at 1636 Devore Rd, San Bernardino, CA 92407 and is currently estimated at $638,759, approximately $295 per square foot. 1636 Devore Rd is a home located in San Bernardino County with nearby schools including Kimbark Elementary School, Cesar E. Chavez Middle School, and Cajon High School.
Ownership History
Date
Name
Owned For
Owner Type
Purchase Details
Closed on
Aug 9, 2010
Sold by
U S Bank National Association
Bought by
Nguyen Kelly Thu Loan
Current Estimated Value
Home Financials for this Owner
Home Financials are based on the most recent Mortgage that was taken out on this home.
Original Mortgage
$176,000
Interest Rate
4.26%
Mortgage Type
New Conventional
Purchase Details
Closed on
Oct 21, 2009
Sold by
Murphy Maria T
Bought by
Us Bank National Association
Purchase Details
Closed on
May 7, 2003
Sold by
Murphy Michael R
Bought by
Murphy Maria T
Home Financials for this Owner
Home Financials are based on the most recent Mortgage that was taken out on this home.
Original Mortgage
$142,000
Interest Rate
6.62%
Mortgage Type
Purchase Money Mortgage
Purchase Details
Closed on
Nov 25, 1996
Sold by
Murphy Michael R
Bought by
Murphy Maria T
Create a Home Valuation Report for This Property
The Home Valuation Report is an in-depth analysis detailing your home's value as well as a comparison with similar homes in the area
Purchase History
| Date | Buyer | Sale Price | Title Company |
|---|---|---|---|
| Nguyen Kelly Thu Loan | $220,000 | Lsi Title Company Inc | |
| Us Bank National Association | $212,974 | Accommodation | |
| Murphy Maria T | -- | Landsafe | |
| Murphy Maria T | -- | -- |
Source: Public Records
Mortgage History
| Date | Status | Borrower | Loan Amount |
|---|---|---|---|
| Previous Owner | Nguyen Kelly Thu Loan | $176,000 | |
| Previous Owner | Murphy Maria T | $142,000 |
Source: Public Records
Tax History
| Year | Tax Paid | Tax Assessment Tax Assessment Total Assessment is a certain percentage of the fair market value that is determined by local assessors to be the total taxable value of land and additions on the property. | Land | Improvement |
|---|---|---|---|---|
| 2025 | $3,382 | $281,859 | $76,870 | $204,989 |
| 2024 | $3,312 | $276,333 | $75,363 | $200,970 |
| 2023 | $3,201 | $270,914 | $73,885 | $197,029 |
| 2022 | $3,186 | $265,602 | $72,436 | $193,166 |
| 2021 | $3,199 | $260,394 | $71,016 | $189,378 |
| 2020 | $3,180 | $257,724 | $70,288 | $187,436 |
| 2019 | $3,082 | $252,671 | $68,910 | $183,761 |
| 2018 | $2,787 | $247,717 | $67,559 | $180,158 |
| 2017 | $2,696 | $242,859 | $66,234 | $176,625 |
| 2016 | $2,586 | $238,097 | $64,935 | $173,162 |
| 2015 | $2,647 | $234,521 | $63,960 | $170,561 |
| 2014 | $2,563 | $229,927 | $62,707 | $167,220 |
Source: Public Records
Map
Nearby Homes
- 0 Meyers Rd Unit CV22260301
- 1244 Knoll St
- 0 Deercrest Dr Unit IG25155038
- 0 Deercrest Dr Unit HD24243602
- 18572 Cajon Blvd
- 1126 Knoll St
- 18611 Deercrest Estates Place
- 18681 Deercrest Estates Place
- 1166 Deercrest Dr
- 1080 Knoll St
- 923 Devore Rd
- 1108 Richmond Hill Ct
- 2150 Glen Helen Rd
- 2234 W Glen Helen Rd
- 625 Kimbark Ave
- 750 Woodlawn Ave
- 0 Kendall Dr Unit PW25070113
- 0 Kendall Dr Unit 25608747
- 0 Foresthill Ct Unit IG25023090
- 3326 Crowfoot Rd
- 18386 Santa fe Ave
- 18378 Santa fe Ave
- 0 Santa fe Unit E11057729
- 0 Santa fe Unit IV13188830
- 18410 Santa fe Ave
- 18372 Santa fe Ave
- 18403 Grandview Ave
- 1650 Devore Rd
- 18366 Santa fe Ave
- 18423 Grandview Ave
- 18424 Santa fe Ave
- 18360 Santa fe Ave
- 18387 Santa fe Ave
- 18431 Grandview Ave
- 18354 Santa fe Ave
- 18331 Grandview Ave
- 18373 Santa fe Ave
- 18430 Santa fe Ave
- 1670 Devore Rd
- 18449 Grandview Ave
Your Personal Tour Guide
Ask me questions while you tour the home.