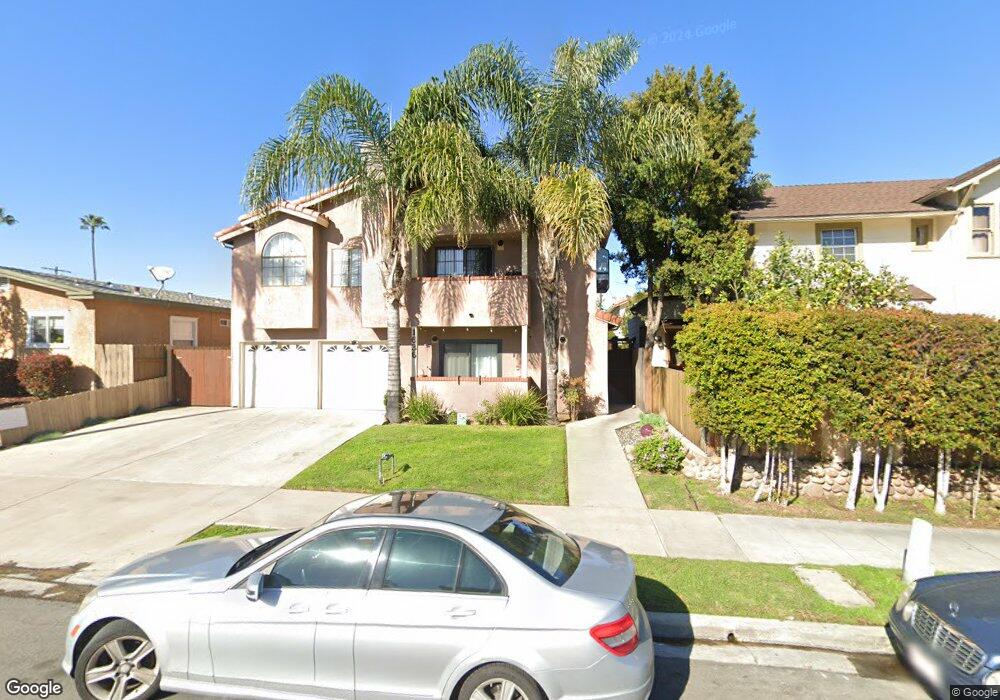
1636 Meade Ave Unit 6 San Diego, CA 92116
University Heights NeighborhoodEstimated Value: $590,453 - $693,000
2
Beds
4
Baths
780
Sq Ft
$833/Sq Ft
Est. Value
About This Home
This home is located at 1636 Meade Ave Unit 6, San Diego, CA 92116 and is currently estimated at $650,113, approximately $833 per square foot. 1636 Meade Ave Unit 6 is a home located in San Diego County with nearby schools including Birney Elementary School, Roosevelt International Middle School, and Kindred Montessori.
Ownership History
Date
Name
Owned For
Owner Type
Purchase Details
Closed on
Feb 21, 2014
Sold by
Piper Sandra
Bought by
Uriostigue Eric
Current Estimated Value
Home Financials for this Owner
Home Financials are based on the most recent Mortgage that was taken out on this home.
Original Mortgage
$280,000
Outstanding Balance
$211,200
Interest Rate
4.29%
Mortgage Type
New Conventional
Estimated Equity
$438,913
Purchase Details
Closed on
Jun 14, 2006
Sold by
Da Rocha Marcelo Buccianti Dias
Bought by
Piper Sandra
Home Financials for this Owner
Home Financials are based on the most recent Mortgage that was taken out on this home.
Original Mortgage
$279,000
Interest Rate
7.65%
Mortgage Type
Purchase Money Mortgage
Purchase Details
Closed on
Jun 1, 2006
Sold by
Meade Holdings Llc
Bought by
Piper Sandra
Home Financials for this Owner
Home Financials are based on the most recent Mortgage that was taken out on this home.
Original Mortgage
$279,000
Interest Rate
7.65%
Mortgage Type
Purchase Money Mortgage
Create a Home Valuation Report for This Property
The Home Valuation Report is an in-depth analysis detailing your home's value as well as a comparison with similar homes in the area
Home Values in the Area
Average Home Value in this Area
Purchase History
| Date | Buyer | Sale Price | Title Company |
|---|---|---|---|
| Uriostigue Eric | $295,000 | Fidelity National Title Co | |
| Piper Sandra | -- | Chicago Title Co | |
| Piper Sandra | $310,000 | Chicago Title Co |
Source: Public Records
Mortgage History
| Date | Status | Borrower | Loan Amount |
|---|---|---|---|
| Open | Uriostigue Eric | $280,000 | |
| Previous Owner | Piper Sandra | $279,000 | |
| Previous Owner | Piper Sandra | $31,000 |
Source: Public Records
Tax History Compared to Growth
Tax History
| Year | Tax Paid | Tax Assessment Tax Assessment Total Assessment is a certain percentage of the fair market value that is determined by local assessors to be the total taxable value of land and additions on the property. | Land | Improvement |
|---|---|---|---|---|
| 2025 | $4,300 | $361,620 | $120,129 | $241,491 |
| 2024 | $4,300 | $354,530 | $117,774 | $236,756 |
| 2023 | $4,203 | $347,579 | $115,465 | $232,114 |
| 2022 | $4,090 | $340,764 | $113,201 | $227,563 |
| 2021 | $4,061 | $334,083 | $110,982 | $223,101 |
| 2020 | $4,011 | $330,659 | $109,845 | $220,814 |
| 2019 | $3,938 | $324,177 | $107,692 | $216,485 |
| 2018 | $3,681 | $317,822 | $105,581 | $212,241 |
| 2017 | $80 | $311,591 | $103,511 | $208,080 |
| 2016 | $3,533 | $305,482 | $101,482 | $204,000 |
| 2015 | $3,480 | $300,894 | $99,958 | $200,936 |
| 2014 | $3,507 | $295,000 | $98,000 | $197,000 |
Source: Public Records
Map
Nearby Homes
- 4438-44 Campus
- 4378 Georgia St
- 4324-26 Cleveland Ave
- 4314-18 Cleveland Ave
- 4551 Maryland St
- 4259-61 Maryland St
- 4622-24 Campus Ave
- 4333 Florida St
- 4655-4663 Campus Ave Unit 9, 11&12
- 4180 Cleveland Ave Unit 10
- 1414 Franciscan Way
- 2144 El Cajon Blvd Unit 29 & 30
- 1108 Madison Ave
- 4525 Rhode Island St
- 4086 Georgia St Unit 4
- 4127 Florida St Unit 1
- 4621 Alabama St
- 1026 Madison Ave
- 4033-37 Park Blvd
- 1237-39 Lincoln Ave
- 1636 Meade Ave
- 1636 Meade Ave Unit 7
- 1636 Meade Ave Unit 5
- 1636 Meade Ave Unit 4
- 1636 Meade Ave Unit 3
- 1636 Meade Ave Unit 2
- 1636 Meade Ave Unit 1
- 4400 North Ave
- 1622 Meade Ave
- 4408 North Ave
- 1616 Meade Ave Unit 18
- 4430 North Ave
- 1612 Meade Ave Unit 14
- 4436 North Ave Unit 38
- 1606 Meade Ave
- 4415 Campus Ave Unit 21
- 4411 North Ave
- 4405 North Ave
- 4419 North Ave
- 4444 North Ave Unit 6