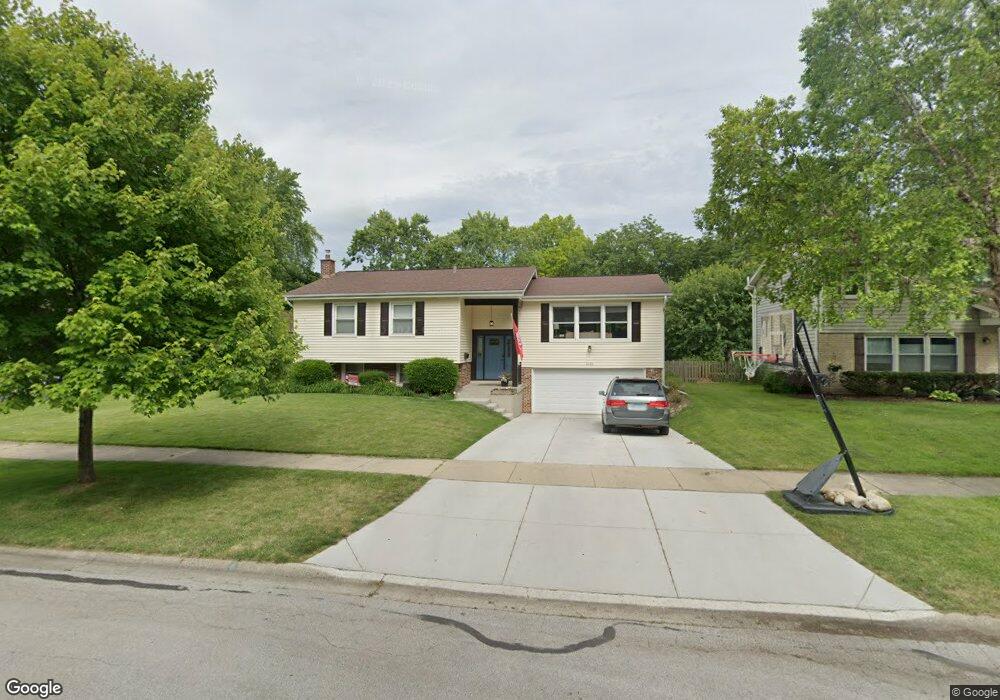
1636 Redpoll Ct Naperville, IL 60565
Maple Brook NeighborhoodEstimated Value: $475,717 - $533,000
4
Beds
3
Baths
1,500
Sq Ft
$336/Sq Ft
Est. Value
About This Home
This home is located at 1636 Redpoll Ct, Naperville, IL 60565 and is currently estimated at $504,179, approximately $336 per square foot. 1636 Redpoll Ct is a home located in DuPage County with nearby schools including Maplebrook Elementary School, Lincoln Jr. High School, and Naperville Central High School.
Ownership History
Date
Name
Owned For
Owner Type
Purchase Details
Closed on
Sep 25, 2008
Sold by
Rieber Hanan M and Siegler Rieber Susan
Bought by
Monteith Brian and Monteith Jessica
Current Estimated Value
Home Financials for this Owner
Home Financials are based on the most recent Mortgage that was taken out on this home.
Original Mortgage
$275,025
Outstanding Balance
$179,702
Interest Rate
6.41%
Mortgage Type
Purchase Money Mortgage
Estimated Equity
$324,477
Purchase Details
Closed on
Jul 23, 2004
Sold by
Francisco James M and Francisco Laura E
Bought by
Rieber Hanan M and Siegler Rieber Susan
Home Financials for this Owner
Home Financials are based on the most recent Mortgage that was taken out on this home.
Original Mortgage
$306,000
Interest Rate
6.34%
Mortgage Type
Purchase Money Mortgage
Create a Home Valuation Report for This Property
The Home Valuation Report is an in-depth analysis detailing your home's value as well as a comparison with similar homes in the area
Home Values in the Area
Average Home Value in this Area
Purchase History
| Date | Buyer | Sale Price | Title Company |
|---|---|---|---|
| Monteith Brian | $290,000 | Pntn | |
| Rieber Hanan M | $306,000 | First American Title |
Source: Public Records
Mortgage History
| Date | Status | Borrower | Loan Amount |
|---|---|---|---|
| Open | Monteith Brian | $275,025 | |
| Previous Owner | Rieber Hanan M | $306,000 |
Source: Public Records
Tax History
| Year | Tax Paid | Tax Assessment Tax Assessment Total Assessment is a certain percentage of the fair market value that is determined by local assessors to be the total taxable value of land and additions on the property. | Land | Improvement |
|---|---|---|---|---|
| 2024 | $7,504 | $130,487 | $74,343 | $56,144 |
| 2023 | $7,219 | $119,090 | $67,850 | $51,240 |
| 2022 | $6,952 | $113,420 | $64,620 | $48,800 |
| 2021 | $6,694 | $109,130 | $62,180 | $46,950 |
| 2020 | $6,550 | $107,170 | $61,060 | $46,110 |
| 2019 | $6,354 | $102,540 | $58,420 | $44,120 |
| 2018 | $6,191 | $100,030 | $56,990 | $43,040 |
| 2017 | $6,063 | $96,660 | $55,070 | $41,590 |
| 2016 | $5,937 | $93,170 | $53,080 | $40,090 |
| 2015 | $5,892 | $87,740 | $49,990 | $37,750 |
| 2014 | $5,773 | $83,560 | $47,610 | $35,950 |
| 2013 | $5,687 | $83,760 | $47,720 | $36,040 |
Source: Public Records
Map
Nearby Homes
- 1751 S Washington St Unit 1
- 1754 S Washington St Unit 1754
- 124 E Bailey Rd Unit E
- 48 Starling Ln
- 138 E Bailey Rd Unit M
- 144 E Bailey Rd Unit D
- 264 E Bailey Rd Unit C
- 228 E Bailey Rd Unit F
- 1712 Coach Dr
- 381 Prairie Knoll Dr
- 321 Carriage Hill Rd
- 1715 Amelia Ct
- 621 Bourbon Ct
- 510 Harlowe Ln Unit 2001C
- 1546 Treeline Ct Unit 405
- 627 Bourbon Ct
- 517 Sheffield Rd
- 307 Leeds Ct
- 425 Carriage Hill Rd
- 2057 Lancaster Cir Unit 101C
- 1632 Redpoll Ct
- 1640 Redpoll Ct
- 1637 Swallow St
- 1641 Swallow St
- 1644 Redpoll Ct
- 1628 Redpoll Ct
- 1633 Swallow St
- 1637 Redpoll Ct
- 1629 Swallow St
- 1645 Swallow St
- 1641 Redpoll Ct
- 1625 Swallow St
- 1625 Redpoll Ct
- 1624 Redpoll Ct
- 1649 Swallow St
- 1648 Redpoll Ct
- 1645 Redpoll Ct
- 1652 Redpoll Ct
- 1653 Swallow St
- 1621 Swallow St
Your Personal Tour Guide
Ask me questions while you tour the home.