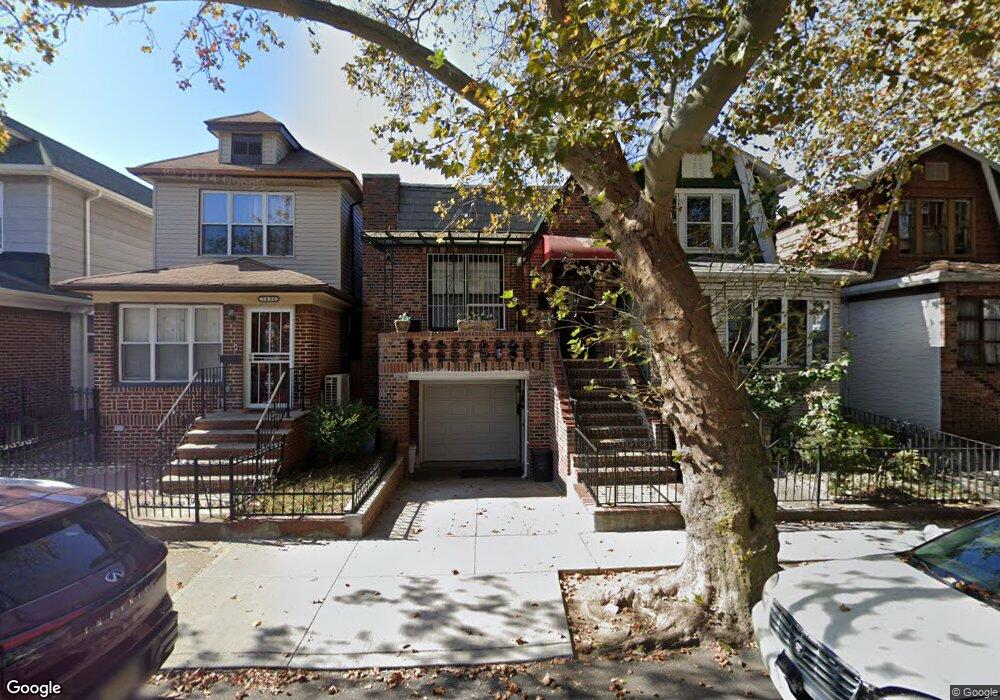
1636 W 4th St Brooklyn, NY 11223
Gravesend NeighborhoodEstimated Value: $1,012,000 - $1,210,000
--
Bed
--
Bath
1,533
Sq Ft
$729/Sq Ft
Est. Value
About This Home
This home is located at 1636 W 4th St, Brooklyn, NY 11223 and is currently estimated at $1,117,395, approximately $728 per square foot. 1636 W 4th St is a home located in Kings County with nearby schools including P.S.177 The Marlboro, Is 228 David A Boody, and Success Academy Charter School - Bensonhurst.
Ownership History
Date
Name
Owned For
Owner Type
Purchase Details
Closed on
Nov 22, 2021
Sold by
Li Jin Huan and Li Man Jin
Bought by
Lin Tai Kun and Wang Aihua
Current Estimated Value
Home Financials for this Owner
Home Financials are based on the most recent Mortgage that was taken out on this home.
Original Mortgage
$558,000
Outstanding Balance
$512,017
Interest Rate
3.09%
Mortgage Type
Purchase Money Mortgage
Estimated Equity
$605,378
Purchase Details
Closed on
Oct 28, 2009
Sold by
Li Christopher and Li Jan
Bought by
Li Jin Huan and Li Man Jin
Home Financials for this Owner
Home Financials are based on the most recent Mortgage that was taken out on this home.
Original Mortgage
$395,000
Interest Rate
4.98%
Mortgage Type
Purchase Money Mortgage
Purchase Details
Closed on
Jul 20, 2000
Sold by
Wong Lawrence S
Bought by
Li Christopher and Li Jan
Create a Home Valuation Report for This Property
The Home Valuation Report is an in-depth analysis detailing your home's value as well as a comparison with similar homes in the area
Home Values in the Area
Average Home Value in this Area
Purchase History
| Date | Buyer | Sale Price | Title Company |
|---|---|---|---|
| Lin Tai Kun | $930,000 | -- | |
| Li Jin Huan | $530,000 | -- | |
| Li Jin Huan | $530,000 | -- | |
| Li Christopher | $225,000 | Commonwealth Land Title Ins | |
| Li Christopher | $225,000 | Commonwealth Land Title Ins |
Source: Public Records
Mortgage History
| Date | Status | Borrower | Loan Amount |
|---|---|---|---|
| Open | Lin Tai Kun | $558,000 | |
| Previous Owner | Li Jin Huan | $395,000 |
Source: Public Records
Tax History Compared to Growth
Tax History
| Year | Tax Paid | Tax Assessment Tax Assessment Total Assessment is a certain percentage of the fair market value that is determined by local assessors to be the total taxable value of land and additions on the property. | Land | Improvement |
|---|---|---|---|---|
| 2025 | $8,204 | $61,440 | $12,300 | $49,140 |
| 2024 | $8,204 | $59,040 | $12,300 | $46,740 |
| 2023 | $7,859 | $66,180 | $12,300 | $53,880 |
| 2022 | $7,296 | $59,700 | $12,300 | $47,400 |
| 2021 | $7,666 | $58,200 | $12,300 | $45,900 |
| 2020 | $3,773 | $52,620 | $12,300 | $40,320 |
| 2019 | $7,120 | $52,620 | $12,300 | $40,320 |
| 2018 | $6,573 | $32,246 | $6,684 | $25,562 |
| 2017 | $6,208 | $30,456 | $7,311 | $23,145 |
| 2016 | $6,068 | $30,356 | $8,050 | $22,306 |
| 2015 | $3,465 | $30,057 | $9,990 | $20,067 |
| 2014 | $3,465 | $28,365 | $9,346 | $19,019 |
Source: Public Records
Map
Nearby Homes
- 1632 W 4th St
- 1641 W 6th St
- 248 Avenue P
- 1683 W 7th St Unit 2A
- 1683 W 7th St Unit 3A
- 1683 W 7th St Unit 4B
- 1683 W 7th St Unit 3B
- 1683 W 7th St Unit 2B
- 1683 W 7th St Unit 5-B
- 1721 W 6th St Unit 2A
- 1623 W 8th St
- 1545 W 5th St
- 1640 W 1st St
- 1560 W 2nd St
- 355 Kings Hwy Unit 5C
- 340 Avenue P
- 1569 W 7th St Unit 3B
- 1569 W 7th St Unit 1A
- 290 Kings Hwy
- 1549 W 3rd St Unit 5B