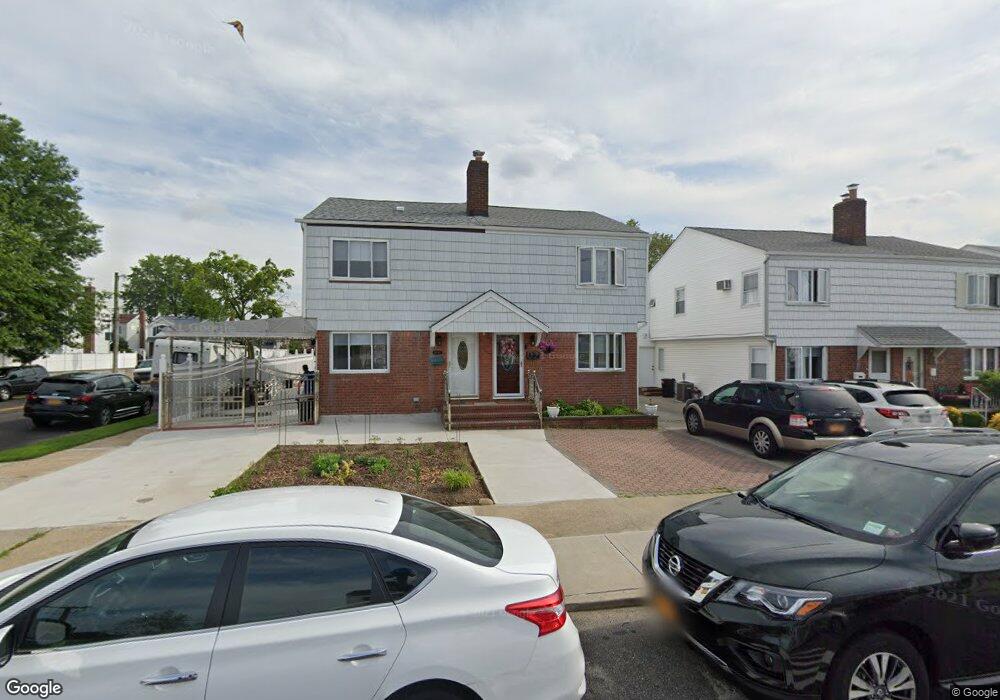
16362 22nd Ave Whitestone, NY 11357
Clearview NeighborhoodEstimated Value: $936,313 - $1,001,000
--
Bed
--
Bath
1,056
Sq Ft
$921/Sq Ft
Est. Value
About This Home
This home is located at 16362 22nd Ave, Whitestone, NY 11357 and is currently estimated at $972,828, approximately $921 per square foot. 16362 22nd Ave is a home located in Queens County with nearby schools including P.S. 184 Flushing Manor, J.H.S. 194 William Carr, and Bayside High School.
Ownership History
Date
Name
Owned For
Owner Type
Purchase Details
Closed on
Aug 15, 2025
Sold by
Chin William Y
Bought by
Chin William Y and Lam Josephine
Current Estimated Value
Purchase Details
Closed on
Apr 29, 2022
Sold by
Kavasilas Christos and Kavasilas Maria
Bought by
Chin William Y
Home Financials for this Owner
Home Financials are based on the most recent Mortgage that was taken out on this home.
Original Mortgage
$591,500
Outstanding Balance
$558,884
Interest Rate
4.67%
Mortgage Type
Purchase Money Mortgage
Estimated Equity
$413,944
Purchase Details
Closed on
Apr 30, 2012
Sold by
Kavasilas Christos
Bought by
Kavasilas Christos and Kavasilas Maria
Purchase Details
Closed on
Dec 22, 2003
Sold by
Murtha Thomas Kevin
Bought by
Kavasilas Christos
Home Financials for this Owner
Home Financials are based on the most recent Mortgage that was taken out on this home.
Original Mortgage
$299,000
Interest Rate
5.62%
Mortgage Type
Purchase Money Mortgage
Create a Home Valuation Report for This Property
The Home Valuation Report is an in-depth analysis detailing your home's value as well as a comparison with similar homes in the area
Home Values in the Area
Average Home Value in this Area
Purchase History
| Date | Buyer | Sale Price | Title Company |
|---|---|---|---|
| Chin William Y | -- | -- | |
| Chin William Y | $910,000 | -- | |
| Kavasilas Christos | -- | -- | |
| Kavasilas Christos | -- | -- | |
| Kavasilas Christos | $424,000 | -- | |
| Kavasilas Christos | $424,000 | -- |
Source: Public Records
Mortgage History
| Date | Status | Borrower | Loan Amount |
|---|---|---|---|
| Open | Chin William Y | $591,500 | |
| Previous Owner | Kavasilas Christos | $299,000 |
Source: Public Records
Tax History Compared to Growth
Tax History
| Year | Tax Paid | Tax Assessment Tax Assessment Total Assessment is a certain percentage of the fair market value that is determined by local assessors to be the total taxable value of land and additions on the property. | Land | Improvement |
|---|---|---|---|---|
| 2025 | $7,840 | $41,374 | $10,492 | $30,882 |
| 2024 | $7,840 | $39,035 | $10,415 | $28,620 |
| 2023 | $7,397 | $36,826 | $9,443 | $27,383 |
| 2022 | $7,063 | $48,360 | $13,800 | $34,560 |
| 2021 | $7,395 | $48,780 | $13,800 | $34,980 |
| 2020 | $7,002 | $46,680 | $13,800 | $32,880 |
| 2019 | $6,512 | $45,720 | $13,800 | $31,920 |
| 2018 | $5,958 | $30,688 | $10,054 | $20,634 |
| 2017 | $5,956 | $30,688 | $11,384 | $19,304 |
| 2016 | $5,778 | $30,688 | $11,384 | $19,304 |
| 2015 | $3,272 | $28,732 | $13,370 | $15,362 |
| 2014 | $3,272 | $27,108 | $12,278 | $14,830 |
Source: Public Records
Map
Nearby Homes
- 16366 23rd Ave
- 166-36 23rd Ave
- 24-31 Francis Lewis Blvd
- 163-69 24th Rd
- 163-39 21st Ave
- 24-65 Francis Lewis Blvd
- 163-28 20th Rd
- 24-06 169th St
- 16627 25th Ave
- 166-51 20th Rd
- 163-32 20th Ave
- 169-20 21st Rd
- 163-61 20th Ave
- 24-44 163rd St
- 16337 20th Ave
- 2531 Francis Lewis Blvd
- 2533 Francis Lewis Blvd
- 163-40 19th Ave
- 163-50 25th Dr
- 160-19 24th Ave
- 163-62 22nd Ave
- 16364 22nd Ave
- 163-60 22nd Ave
- 16360 22nd Ave
- 16364 22nd Ave
- 16358 22nd Ave
- 16354 22nd Ave
- 16365 23rd Ave
- 16363 23rd Ave
- 16367 23rd Ave
- 16363 23rd Ave
- 16352 22nd Ave
- 16361 23rd Ave
- 16357 23rd Ave
- 16350 22nd Ave
- 16350 22nd Ave
- 16350 22nd Ave
- 16357 23rd Ave
- 16604 22nd Ave
- 166-04 22nd Ave