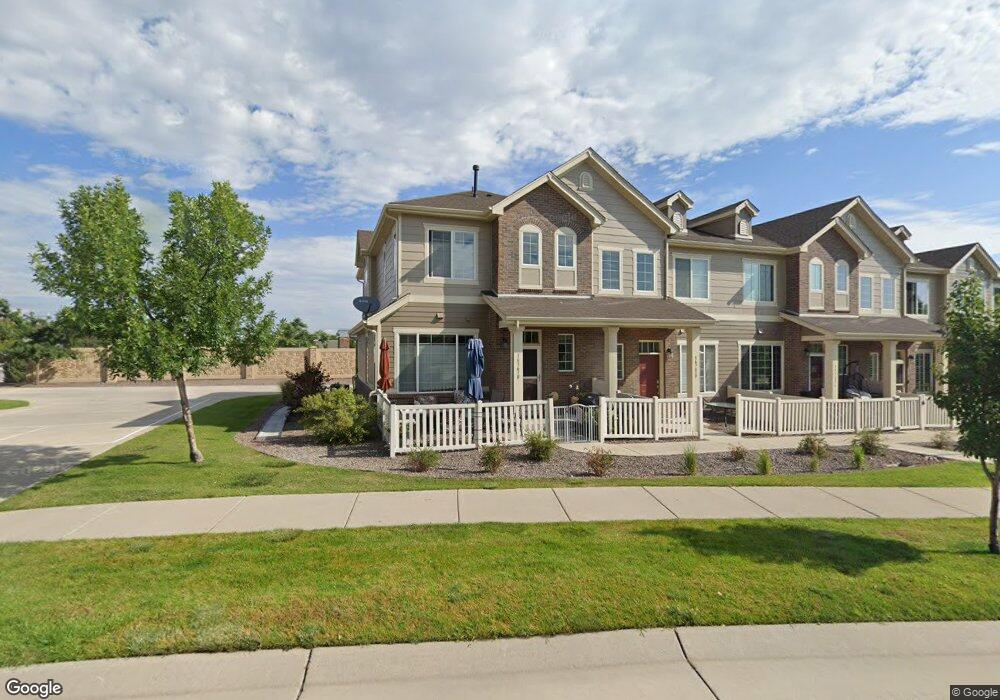
16363 W 63rd Place Unit C Arvada, CO 80403
Estimated Value: $490,571 - $538,000
3
Beds
3
Baths
1,522
Sq Ft
$336/Sq Ft
Est. Value
About This Home
This home is located at 16363 W 63rd Place Unit C, Arvada, CO 80403 and is currently estimated at $511,393, approximately $336 per square foot. 16363 W 63rd Place Unit C is a home located in Jefferson County with nearby schools including Fairmount Elementary School, Drake Junior High School, and Arvada West High School.
Ownership History
Date
Name
Owned For
Owner Type
Purchase Details
Closed on
Sep 9, 2020
Sold by
Lawrence Brandi R and Lawrence Beth M
Bought by
Lawrence Beth M and Lawrence Brandi R
Current Estimated Value
Home Financials for this Owner
Home Financials are based on the most recent Mortgage that was taken out on this home.
Original Mortgage
$292,500
Outstanding Balance
$259,574
Interest Rate
2.9%
Mortgage Type
New Conventional
Estimated Equity
$251,819
Purchase Details
Closed on
Dec 2, 2016
Sold by
Anderson Arleene D
Bought by
Lawrence Brandi R and Lawrence Beth M
Home Financials for this Owner
Home Financials are based on the most recent Mortgage that was taken out on this home.
Original Mortgage
$309,294
Interest Rate
3.5%
Mortgage Type
FHA
Purchase Details
Closed on
Mar 20, 2015
Sold by
Enclave At Boyd Ponds Llc
Bought by
Anderson Arleene D
Create a Home Valuation Report for This Property
The Home Valuation Report is an in-depth analysis detailing your home's value as well as a comparison with similar homes in the area
Home Values in the Area
Average Home Value in this Area
Purchase History
| Date | Buyer | Sale Price | Title Company |
|---|---|---|---|
| Lawrence Beth M | -- | Chicago Title Co | |
| Lawrence Brandi R | $315,000 | Land Title Guarantee Co | |
| Anderson Arleene D | $290,187 | First American |
Source: Public Records
Mortgage History
| Date | Status | Borrower | Loan Amount |
|---|---|---|---|
| Open | Lawrence Beth M | $292,500 | |
| Closed | Lawrence Brandi R | $309,294 |
Source: Public Records
Tax History Compared to Growth
Tax History
| Year | Tax Paid | Tax Assessment Tax Assessment Total Assessment is a certain percentage of the fair market value that is determined by local assessors to be the total taxable value of land and additions on the property. | Land | Improvement |
|---|---|---|---|---|
| 2024 | $3,711 | $30,034 | $6,030 | $24,004 |
| 2023 | $3,711 | $30,034 | $6,030 | $24,004 |
| 2022 | $3,131 | $23,380 | $4,170 | $19,210 |
| 2021 | $3,242 | $24,053 | $4,290 | $19,763 |
| 2020 | $3,208 | $23,853 | $4,290 | $19,563 |
| 2019 | $3,177 | $23,853 | $4,290 | $19,563 |
| 2018 | $3,152 | $23,191 | $3,600 | $19,591 |
| 2017 | $3,220 | $23,191 | $3,600 | $19,591 |
| 2016 | $3,057 | $21,813 | $2,866 | $18,947 |
| 2015 | $1,040 | $14,726 | $4,776 | $9,950 |
| 2014 | $984 | $6,728 | $6,728 | $0 |
Source: Public Records
Map
Nearby Homes
- 6268 Pike Ct Unit D
- 6462 Quartz Cir
- 15952 W 63rd Ln Unit A
- 16019 W 62nd Dr
- 16690 W 63rd Place
- 15902 W 64th Ave
- 16887 W 62nd Place
- 6264 Salvia Ln
- 16929 W 63rd Ln
- 16965 W 62nd Cir
- 6271 Mcintyre Way
- 16340 92nd Cir
- 16947 92nd Cir
- 15894 W 67th Place
- 15492 W 65th Ave Unit C
- 15957 W 60th Cir
- 15496 W 66th Dr Unit C
- 15516 W 66th Dr Unit A
- 17297 W 61st Ct
- 15374 W 63rd Ave Unit 101
- 16363 W 63rd Place Unit A
- 16363 W 63rd Place Unit 1A
- 16363 W 63rd Place
- 6293 Poppy Ct Unit D
- 6293 Poppy Ct
- 6293 Poppy Ct Unit B
- 6293 Poppy Ct Unit C
- 6293 Poppy Ct Unit A
- 16313 W 63rd Place Unit A
- 16313 W 63rd Place Unit D
- 16313 W 63rd Place
- 16313 W 63rd Place Unit B
- 16335 W 62nd Ln Unit B
- 16335 W 62nd Ln Unit C
- 16335 W 62nd Ln Unit D
- 16335 W 62nd Ln Unit A
- 16335 W 62nd Ln Unit 2E
- 16335 W 62nd Ln Unit 30D
- 16335 W 62nd Ln Unit C
- 16335 W 62nd Ln