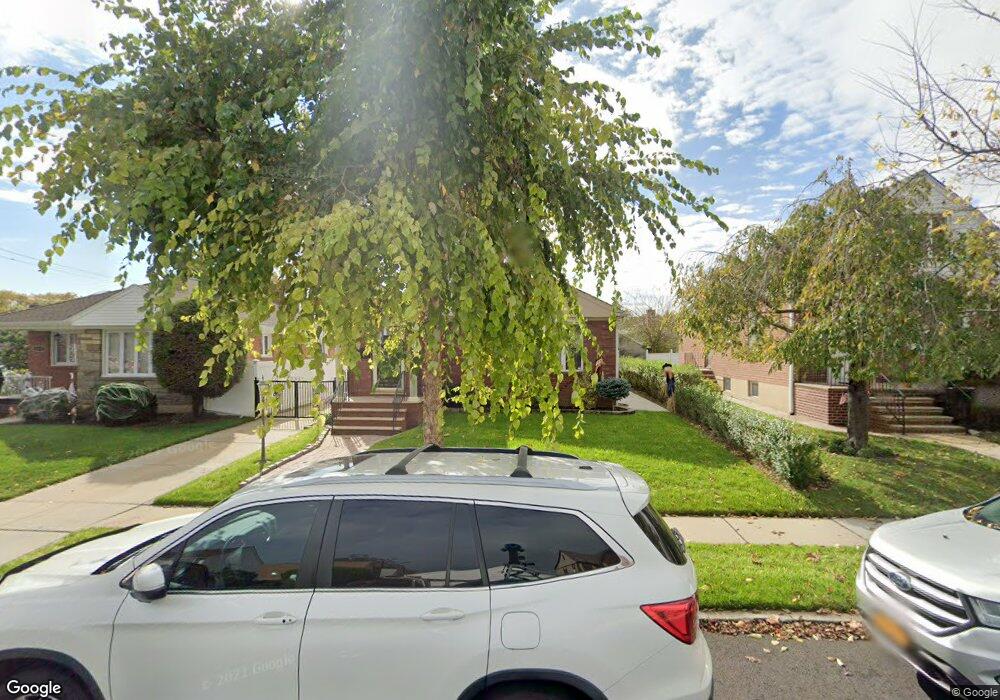
16366 25th Dr Flushing, NY 11358
Flushing NeighborhoodEstimated Value: $1,125,000 - $1,174,000
Studio
--
Bath
1,100
Sq Ft
$1,052/Sq Ft
Est. Value
About This Home
This home is located at 16366 25th Dr, Flushing, NY 11358 and is currently estimated at $1,157,000, approximately $1,051 per square foot. 16366 25th Dr is a home located in Queens County with nearby schools including P.S. 184 Flushing Manor, I.S. 25 Adrien Block, and Francis Lewis High School.
Ownership History
Date
Name
Owned For
Owner Type
Purchase Details
Closed on
Dec 23, 2015
Sold by
Barretta Anthony
Bought by
Lee Wai Lun and Luo Yan Wen
Current Estimated Value
Home Financials for this Owner
Home Financials are based on the most recent Mortgage that was taken out on this home.
Original Mortgage
$574,000
Outstanding Balance
$454,372
Interest Rate
3.98%
Mortgage Type
New Conventional
Estimated Equity
$702,628
Purchase Details
Closed on
Sep 28, 2006
Sold by
Mangra Franklin
Bought by
Barretta Anthony
Home Financials for this Owner
Home Financials are based on the most recent Mortgage that was taken out on this home.
Original Mortgage
$288,000
Interest Rate
6.47%
Mortgage Type
Purchase Money Mortgage
Purchase Details
Closed on
Nov 14, 2005
Sold by
Krische James and St Peter Claver Church
Bought by
Mangra Franklin
Purchase Details
Closed on
Jun 26, 2002
Sold by
Kobbe Dorothy M
Bought by
Kobbe Dorothy M and Dorothy M Kobbe Living T
Create a Home Valuation Report for This Property
The Home Valuation Report is an in-depth analysis detailing your home's value as well as a comparison with similar homes in the area
Home Values in the Area
Average Home Value in this Area
Purchase History
| Date | Buyer | Sale Price | Title Company |
|---|---|---|---|
| Lee Wai Lun | $820,000 | -- | |
| Lee Wai Lun | $820,000 | -- | |
| Lee Wai Lun | $820,000 | -- | |
| Barretta Anthony | $615,000 | -- | |
| Barretta Anthony | $615,000 | -- | |
| Mangra Franklin | -- | -- | |
| Mangra Franklin | -- | -- | |
| Kobbe Dorothy M | -- | -- | |
| Kobbe Dorothy M | -- | -- |
Source: Public Records
Mortgage History
| Date | Status | Borrower | Loan Amount |
|---|---|---|---|
| Open | Lee Wai Lun | $574,000 | |
| Closed | Lee Wai Lun | $574,000 | |
| Previous Owner | Barretta Anthony | $288,000 |
Source: Public Records
Tax History
| Year | Tax Paid | Tax Assessment Tax Assessment Total Assessment is a certain percentage of the fair market value that is determined by local assessors to be the total taxable value of land and additions on the property. | Land | Improvement |
|---|---|---|---|---|
| 2025 | $10,632 | $56,110 | $15,665 | $40,445 |
| 2024 | $10,632 | $52,934 | $14,875 | $38,059 |
| 2023 | $10,030 | $49,939 | $14,962 | $34,977 |
| 2022 | $10,010 | $54,600 | $17,940 | $36,660 |
| 2021 | $10,110 | $53,160 | $17,940 | $35,220 |
| 2020 | $9,897 | $56,280 | $17,940 | $38,340 |
| 2019 | $9,228 | $57,360 | $17,940 | $39,420 |
| 2018 | $8,706 | $41,616 | $13,749 | $27,867 |
| 2017 | $8,373 | $41,073 | $14,850 | $26,223 |
| 2016 | $8,003 | $41,073 | $14,850 | $26,223 |
Source: Public Records
Map
Nearby Homes
- 25-26 Bayside Ln
- 16407 27th Ave
- 24-65 Francis Lewis Blvd
- 2533 Francis Lewis Blvd
- 2724 166th St
- 27-22 Bayside Ln
- 24-44 163rd St
- 27-25 168th St
- 16366 23rd Ave
- 16042 26th Ave
- 166-36 23rd Ave
- 29 Avenue
- 160-31 24th Ave
- 16662 22nd Ave
- 2942 164th St
- 29-37 168th St
- 160-19 24th Ave
- 16419 32nd Ave
- 24-14 160th St
- 28-07 172nd St
- 163-66 25th Dr
- 16360 25th Dr
- 16370 25th Dr
- 16365 26th Ave
- 16356 25th Dr
- 16365 26th Ave
- 16369 26th Ave Unit 1Floor
- 16369 26th Ave
- 16369 26th Ave
- 16369 26th Ave Unit 1Floor
- 16369 26th Ave
- 16359 26th Ave
- 16369 26th Ave
- 16355 26th Ave
- 163-67 166 St
- 16350 25th Dr
- 16351 26th Ave
- 163-51 26th Ave
- 2546 Bayside Ln
- 2544 Bayside Ln
Your Personal Tour Guide
Ask me questions while you tour the home.