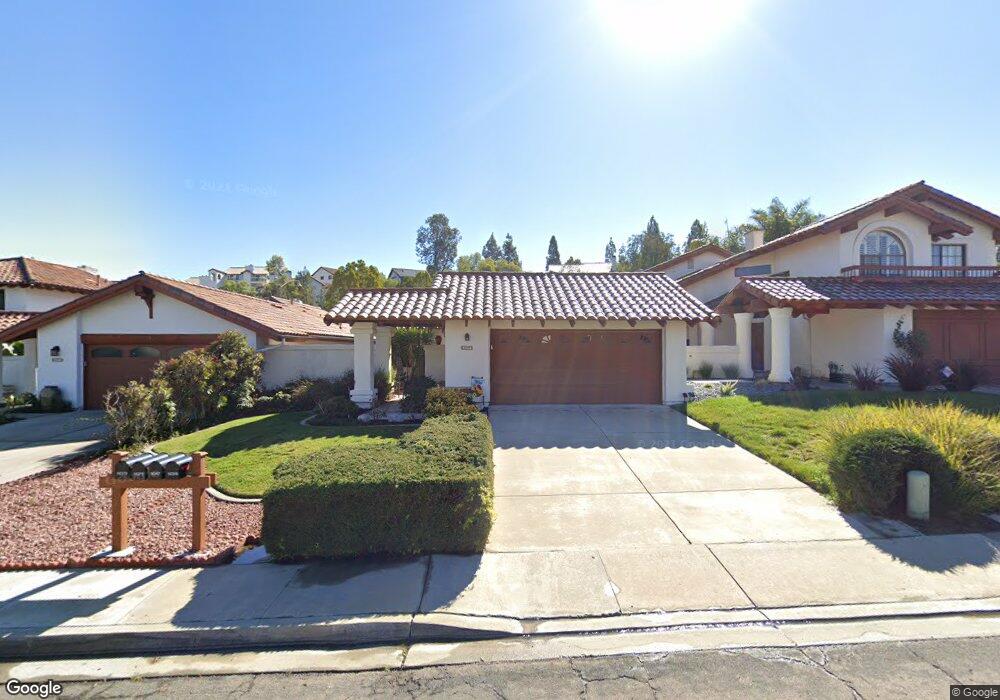
16367 Avenida Nobleza San Diego, CA 92128
Rancho Bernardo NeighborhoodEstimated Value: $950,232 - $1,301,000
2
Beds
2
Baths
1,416
Sq Ft
$762/Sq Ft
Est. Value
About This Home
This home is located at 16367 Avenida Nobleza, San Diego, CA 92128 and is currently estimated at $1,078,558, approximately $761 per square foot. 16367 Avenida Nobleza is a home located in San Diego County with nearby schools including Highland Ranch Elementary School, Bernardo Heights Middle, and Rancho Bernardo High.
Ownership History
Date
Name
Owned For
Owner Type
Purchase Details
Closed on
Jul 15, 2015
Sold by
Townsend Arthur Louis and Townsend Judith Lynn
Bought by
Townsend Arthur Louis and Townsend Judith Lynn
Current Estimated Value
Purchase Details
Closed on
Dec 7, 1998
Sold by
Financial Data Systems Inc Pension Plan
Bought by
Townsend Arthur L and Townsend Judith L
Home Financials for this Owner
Home Financials are based on the most recent Mortgage that was taken out on this home.
Original Mortgage
$207,100
Outstanding Balance
$47,571
Interest Rate
6.91%
Estimated Equity
$1,030,987
Purchase Details
Closed on
Oct 14, 1991
Purchase Details
Closed on
Jun 30, 1989
Purchase Details
Closed on
May 6, 1983
Create a Home Valuation Report for This Property
The Home Valuation Report is an in-depth analysis detailing your home's value as well as a comparison with similar homes in the area
Home Values in the Area
Average Home Value in this Area
Purchase History
| Date | Buyer | Sale Price | Title Company |
|---|---|---|---|
| Townsend Arthur Louis | -- | None Available | |
| Townsend Arthur L | $219,000 | Chicago Title Co | |
| -- | $179,700 | -- | |
| -- | $195,000 | -- | |
| -- | $141,900 | -- |
Source: Public Records
Mortgage History
| Date | Status | Borrower | Loan Amount |
|---|---|---|---|
| Open | Townsend Arthur L | $207,100 |
Source: Public Records
Tax History Compared to Growth
Tax History
| Year | Tax Paid | Tax Assessment Tax Assessment Total Assessment is a certain percentage of the fair market value that is determined by local assessors to be the total taxable value of land and additions on the property. | Land | Improvement |
|---|---|---|---|---|
| 2025 | $3,745 | $343,306 | $156,761 | $186,545 |
| 2024 | $3,745 | $336,576 | $153,688 | $182,888 |
| 2023 | $3,663 | $329,977 | $150,675 | $179,302 |
| 2022 | $3,600 | $323,508 | $147,721 | $175,787 |
| 2021 | $3,552 | $317,166 | $144,825 | $172,341 |
| 2020 | $3,504 | $313,914 | $143,340 | $170,574 |
| 2019 | $3,411 | $307,760 | $140,530 | $167,230 |
| 2018 | $3,314 | $301,726 | $137,775 | $163,951 |
| 2017 | $3,224 | $295,811 | $135,074 | $160,737 |
| 2016 | $3,156 | $290,012 | $132,426 | $157,586 |
| 2015 | $3,108 | $285,656 | $130,437 | $155,219 |
| 2014 | -- | $280,061 | $127,882 | $152,179 |
Source: Public Records
Map
Nearby Homes
- 16232 Avenida Venusto Unit B
- 16244 Avenida Venusto Unit A
- 16130 Avenida Venusto Unit 21
- 16150 Avenida Venusto Unit 1
- 16731 Acena Dr
- 12047 Avenida Consentido
- 16003 Caminito de Linda
- 12085 Calle de Maria
- 16205 Via Embeleso
- 12141 Iron View Row
- 16602 San Salvador Ct
- 11781 Caminito de Las Missiones
- 12097 Pastoral Rd
- 12195 San Tomas Place
- 12257 Avenida Consentido
- 16421 Ramada Dr
- 16866 Acebo Dr
- 12325 Fairway Pointe Row
- 12122 Royal Birkdale Row Unit 403
- 12365 Horado Rd
- 16359 Avenida Nobleza Unit 3
- 16373 Avenida Nobleza
- 16379 Avenida Nobleza
- 16353 Avenida Nobleza
- 16383 Avenida Nobleza
- 16345 Avenida Nobleza
- 16393 Avenida Nobleza
- 16339 Avenida Nobleza Unit 3
- 16366 Avenida Nobleza
- 16360 Avenida Nobleza
- 16370 Avenida Nobleza
- 16356 Avenida Nobleza
- 16376 Avenida Nobleza
- 16333 Avenida Nobleza
- 16350 Avenida Nobleza
- 16380 Avenida Nobleza
- 16346 Avenida Nobleza
- 16390 Avenida Nobleza
- 16327 Avenida Nobleza
- 16340 Avenida Nobleza