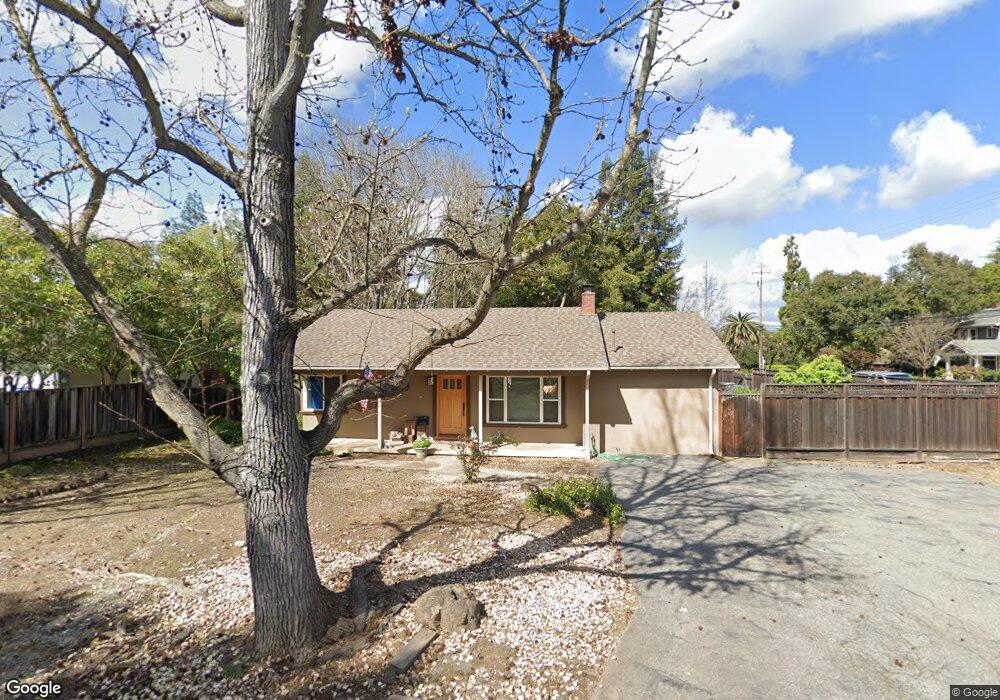
16369 Peacock Ln Los Gatos, CA 95032
East Los Gatos NeighborhoodEstimated Value: $2,207,671 - $3,349,000
3
Beds
2
Baths
1,120
Sq Ft
$2,465/Sq Ft
Est. Value
About This Home
This home is located at 16369 Peacock Ln, Los Gatos, CA 95032 and is currently estimated at $2,760,418, approximately $2,464 per square foot. 16369 Peacock Ln is a home located in Santa Clara County with nearby schools including Blossom Hill Elementary School, Loma Prieta Elementary School, and Raymond J. Fisher Middle School.
Ownership History
Date
Name
Owned For
Owner Type
Purchase Details
Closed on
Jun 17, 2009
Sold by
Cook Shirley Lee
Bought by
Cook Shirley Lee
Current Estimated Value
Home Financials for this Owner
Home Financials are based on the most recent Mortgage that was taken out on this home.
Original Mortgage
$395,000
Interest Rate
4.83%
Mortgage Type
New Conventional
Purchase Details
Closed on
Mar 6, 2002
Sold by
Cook Shirley Lee
Bought by
Cook Shirley Lee
Home Financials for this Owner
Home Financials are based on the most recent Mortgage that was taken out on this home.
Original Mortgage
$215,000
Interest Rate
6.99%
Purchase Details
Closed on
Aug 10, 2001
Sold by
Cook Shirley L
Bought by
Cook Shirley Lee
Purchase Details
Closed on
Mar 11, 1997
Sold by
Cook Blance Revocable Inter Vivos Trust and Dennis W
Bought by
Cook Shirley L
Home Financials for this Owner
Home Financials are based on the most recent Mortgage that was taken out on this home.
Original Mortgage
$175,000
Interest Rate
7.9%
Create a Home Valuation Report for This Property
The Home Valuation Report is an in-depth analysis detailing your home's value as well as a comparison with similar homes in the area
Home Values in the Area
Average Home Value in this Area
Purchase History
| Date | Buyer | Sale Price | Title Company |
|---|---|---|---|
| Cook Shirley Lee | -- | First American Title Company | |
| Cook Shirley Lee | -- | First American Title Company | |
| Cook Shirley Lee | -- | First American Title Guarant | |
| Cook Shirley Lee | -- | First American Title Guarant | |
| Cook Shirley Lee | -- | -- | |
| Cook Shirley L | -- | North American Title Co |
Source: Public Records
Mortgage History
| Date | Status | Borrower | Loan Amount |
|---|---|---|---|
| Closed | Cook Shirley Lee | $395,000 | |
| Closed | Cook Shirley Lee | $215,000 | |
| Closed | Cook Shirley L | $175,000 |
Source: Public Records
Tax History Compared to Growth
Tax History
| Year | Tax Paid | Tax Assessment Tax Assessment Total Assessment is a certain percentage of the fair market value that is determined by local assessors to be the total taxable value of land and additions on the property. | Land | Improvement |
|---|---|---|---|---|
| 2025 | $2,009 | $83,102 | $29,309 | $53,793 |
| 2024 | $2,009 | $81,474 | $28,735 | $52,739 |
| 2023 | $1,986 | $79,877 | $28,172 | $51,705 |
| 2022 | $1,984 | $78,312 | $27,620 | $50,692 |
| 2021 | $1,886 | $76,778 | $27,079 | $49,699 |
| 2020 | $1,881 | $75,992 | $26,802 | $49,190 |
| 2019 | $1,854 | $74,503 | $26,277 | $48,226 |
| 2018 | $1,808 | $73,043 | $25,762 | $47,281 |
| 2017 | $1,774 | $71,611 | $25,257 | $46,354 |
| 2016 | $1,697 | $70,208 | $24,762 | $45,446 |
| 2015 | $1,649 | $69,155 | $24,391 | $44,764 |
| 2014 | $1,599 | $67,802 | $23,914 | $43,888 |
Source: Public Records
Map
Nearby Homes
- 16460 B Bonnie Ln
- 137 Fairmead Ln
- 15985 Shannon Rd
- 170 Twin Oaks Dr
- 106 Longmeadow Dr
- 0 Twin Oaks Dr Unit ML81936703
- 16717 Shannon Rd
- 15811 Orange Blossom Ln
- 16760 Magneson Loop
- 105 Via Santa Maria
- 16244 Kennedy Rd
- 129 Dover St
- 15560 Blossom Hill Rd
- 16497 S Kennedy Rd
- 15315 Santella Ct
- 120 Pinta Ct
- 15571 Linda Ave
- 120 Carlton Ave Unit 22
- 16973 Roberts Rd
- 14721 Shannon Rd
- 16385 Peacock Ln
- 100 Lansberry Ct
- 16200 Shannon Rd
- 16401 Peacock Ln
- 16201 Shannon Rd
- 16370 Peacock Ln
- 16384 Peacock Ln
- 101 Amanda Ln
- 16230 Shannon Rd
- 106 Lansberry Ct
- 16398 Peacock Ln
- 103 Amanda Ln
- 105 Lansberry Ct
- 16417 Peacock Ln
- 16380 Bonnie Ln
- 16412 Peacock Ln
- 16221 Shannon Rd
- 16140 Shannon Rd
- 110 Lansberry Ct
- 107 Amanda Ln