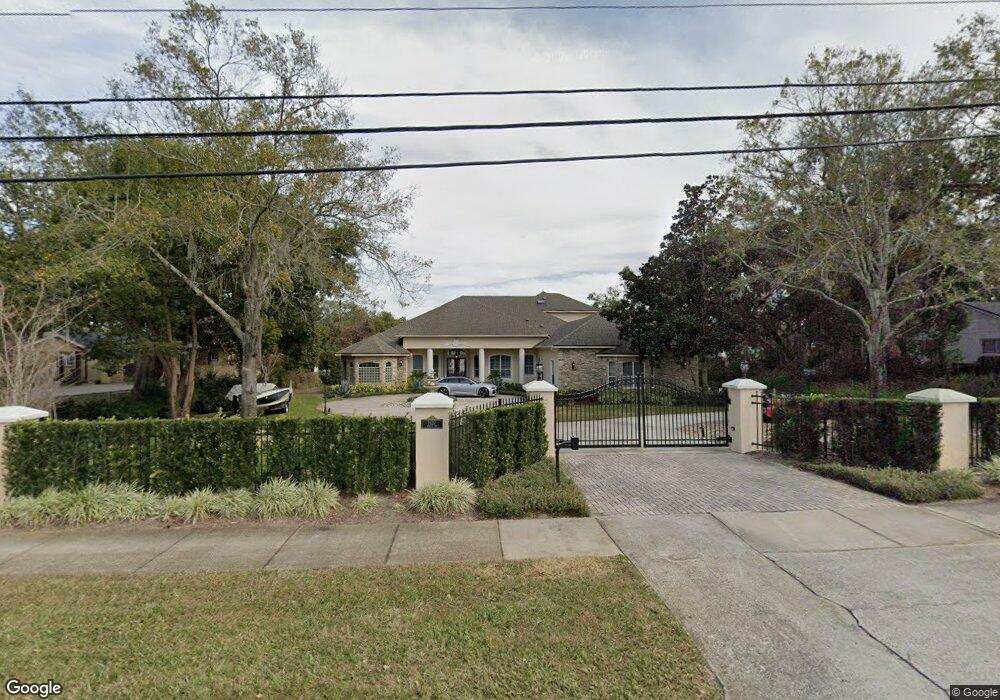
1637 Hempel Ave Unit n.a. Windermere, FL 34786
Estimated Value: $1,694,000 - $2,677,000
4
Beds
5
Baths
4,910
Sq Ft
$450/Sq Ft
Est. Value
About This Home
This home is located at 1637 Hempel Ave Unit n.a., Windermere, FL 34786 and is currently estimated at $2,210,798, approximately $450 per square foot. 1637 Hempel Ave Unit n.a. is a home located in Orange County with nearby schools including Thornebrooke Elementary School, Gotha Middle School, and Olympia High.
Ownership History
Date
Name
Owned For
Owner Type
Purchase Details
Closed on
Jun 8, 2022
Sold by
Joel Kitchen William
Bought by
Kitchen William Joel and Espinel Camilo F
Current Estimated Value
Purchase Details
Closed on
Feb 28, 2005
Sold by
Rampi Richard C and Rampi Patricia
Bought by
Rodgers Terry A and Hudson Robert L
Home Financials for this Owner
Home Financials are based on the most recent Mortgage that was taken out on this home.
Original Mortgage
$270,000
Interest Rate
5.61%
Mortgage Type
Seller Take Back
Purchase Details
Closed on
Dec 3, 1998
Sold by
Harrison John R and Harrison M
Bought by
Larios Carmen
Purchase Details
Closed on
Oct 29, 1997
Sold by
Harrison John R and Harrison M
Bought by
Bailey George R and Bailey Anne S
Create a Home Valuation Report for This Property
The Home Valuation Report is an in-depth analysis detailing your home's value as well as a comparison with similar homes in the area
Home Values in the Area
Average Home Value in this Area
Purchase History
| Date | Buyer | Sale Price | Title Company |
|---|---|---|---|
| Kitchen William Joel | -- | Dyer W Thomas | |
| Rodgers Terry A | $345,000 | -- | |
| Larios Carmen | $215,000 | -- | |
| Bailey George R | $15,000 | -- |
Source: Public Records
Mortgage History
| Date | Status | Borrower | Loan Amount |
|---|---|---|---|
| Previous Owner | Rodgers Terry A | $270,000 | |
| Previous Owner | Bailey George R | $275,000 | |
| Previous Owner | Bailey George R | $300,700 | |
| Previous Owner | Bailey George R | $330,000 |
Source: Public Records
Tax History Compared to Growth
Tax History
| Year | Tax Paid | Tax Assessment Tax Assessment Total Assessment is a certain percentage of the fair market value that is determined by local assessors to be the total taxable value of land and additions on the property. | Land | Improvement |
|---|---|---|---|---|
| 2025 | $17,622 | $1,169,461 | -- | -- |
| 2024 | $16,402 | $1,136,502 | -- | -- |
| 2023 | $16,402 | $1,072,303 | $0 | $0 |
| 2022 | $15,930 | $1,041,071 | $415,000 | $626,071 |
| 2021 | $15,374 | $943,070 | $390,000 | $553,070 |
| 2020 | $11,955 | $792,217 | $0 | $0 |
| 2019 | $12,351 | $774,406 | $0 | $0 |
| 2018 | $12,267 | $759,967 | $0 | $0 |
| 2017 | $12,134 | $967,142 | $330,000 | $637,142 |
| 2016 | $12,113 | $949,426 | $330,000 | $619,426 |
| 2015 | $12,328 | $933,134 | $300,000 | $633,134 |
| 2014 | $12,460 | $874,145 | $245,000 | $629,145 |
Source: Public Records
Map
Nearby Homes
- 1516 Hempel Ave
- 9639 Westover Roberts Rd
- 0 Quail Cove Ct
- 9575 Westover Roberts Rd
- 9802 6th St
- 9335 Westover Club Cir
- 9648 Weatherstone Ct
- 1924 Katie Hill Way
- 9792 Wild Oak Dr
- 9631 Hollyglen Place
- 9649 Weatherstone Ct
- 1703 Roberts Landing Rd
- 1661 Roberts Landing Rd
- 9237 Mcdavid Ct
- 1127 Hempel Ave
- 10506 Down Lakeview Cir
- 1724 Windermeredown Place
- 2107 Westover Reserve Blvd
- 364 Calliope St
- 10545 Down Lakeview Cir
- 1637 Hempel Ave
- 1629 Hempel Ave
- 1725 Hempel Ave
- 1621 Hempel Ave
- 1733 Hempel Ave
- 1613 Hempel Ave
- 1734 Hempel Ave
- 1821 Hempel Ave
- 1605 Hempel Ave
- 9714 English Pine Ct
- 1742 Hempel Ave
- 1788 Hempel Ave
- 1541 Hempel Ave
- 9720 English Pine Ct
- 9715 English Pine Ct
- 9601 Westover Roberts Rd
- 1544 Hempel Ave
- 1533 Hempel Ave
- 9665 Westover Roberts Rd
- 9721 English Pine Ct