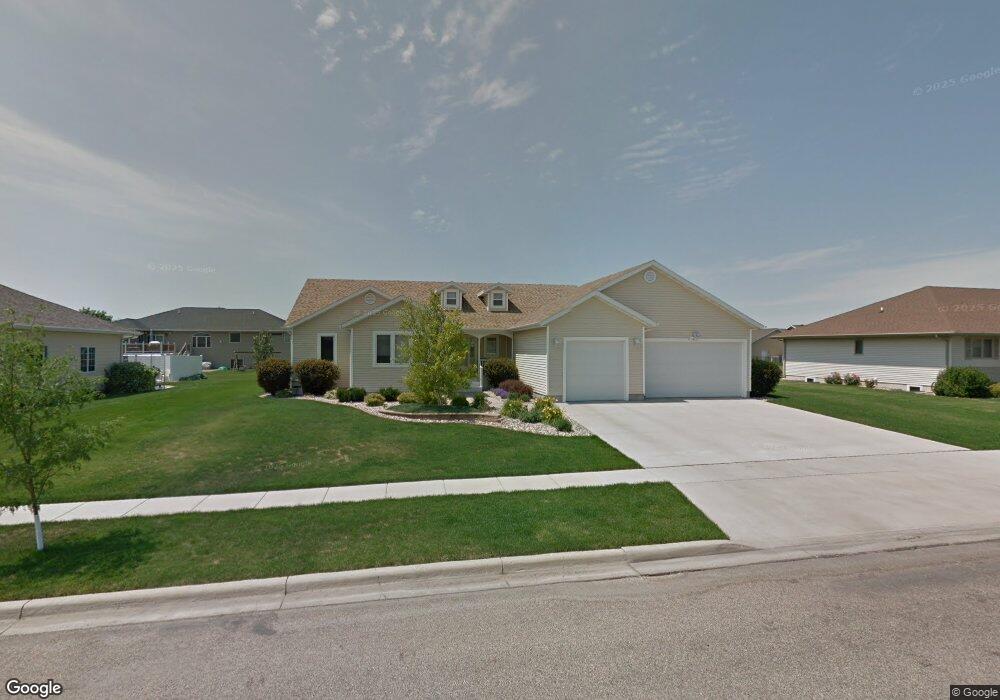
1637 Northview Ln Aberdeen, SD 57401
Estimated Value: $425,282 - $927,000
4
Beds
2
Baths
4,072
Sq Ft
$146/Sq Ft
Est. Value
About This Home
This home is located at 1637 Northview Ln, Aberdeen, SD 57401 and is currently estimated at $594,071, approximately $145 per square foot. 1637 Northview Ln is a home located in Brown County with nearby schools including C.C. Lee Elementary School, Holgate Middle School, and Central High School.
Ownership History
Date
Name
Owned For
Owner Type
Purchase Details
Closed on
May 4, 2007
Sold by
Moench Gerald D and Brockel Jeffrey C
Bought by
Ryan Dennis A and Ryan Inez I
Current Estimated Value
Home Financials for this Owner
Home Financials are based on the most recent Mortgage that was taken out on this home.
Original Mortgage
$121,000
Outstanding Balance
$73,361
Interest Rate
6.2%
Mortgage Type
New Conventional
Estimated Equity
$520,710
Purchase Details
Closed on
Jul 20, 2006
Sold by
North Plains Estates Ii Inc
Bought by
Moench Gerald D and Brokel Jeffrey C
Home Financials for this Owner
Home Financials are based on the most recent Mortgage that was taken out on this home.
Original Mortgage
$210,000
Interest Rate
6.73%
Mortgage Type
Future Advance Clause Open End Mortgage
Create a Home Valuation Report for This Property
The Home Valuation Report is an in-depth analysis detailing your home's value as well as a comparison with similar homes in the area
Home Values in the Area
Average Home Value in this Area
Purchase History
| Date | Buyer | Sale Price | Title Company |
|---|---|---|---|
| Ryan Dennis A | $271,000 | None Available | |
| Moench Gerald D | $25,500 | None Available |
Source: Public Records
Mortgage History
| Date | Status | Borrower | Loan Amount |
|---|---|---|---|
| Open | Ryan Dennis A | $121,000 | |
| Previous Owner | Moench Gerald D | $210,000 |
Source: Public Records
Tax History Compared to Growth
Tax History
| Year | Tax Paid | Tax Assessment Tax Assessment Total Assessment is a certain percentage of the fair market value that is determined by local assessors to be the total taxable value of land and additions on the property. | Land | Improvement |
|---|---|---|---|---|
| 2025 | $7,345 | $449,926 | $30,594 | $419,332 |
| 2024 | $6,905 | $450,237 | $35,353 | $414,884 |
| 2023 | $6,818 | $415,038 | $24,801 | $390,237 |
| 2022 | $6,702 | $394,499 | $24,801 | $369,698 |
| 2021 | $6,398 | $378,068 | $24,801 | $353,267 |
| 2020 | $5,957 | $357,445 | $24,801 | $332,644 |
| 2019 | $6,038 | $337,079 | $24,801 | $312,278 |
| 2018 | $5,815 | $337,079 | $24,801 | $312,278 |
| 2017 | -- | $337,079 | $24,801 | $312,278 |
| 2016 | -- | $334,232 | $0 | $334,232 |
| 2015 | -- | $334,232 | $0 | $334,232 |
| 2014 | -- | $333,923 | $0 | $333,923 |
| 2011 | -- | $313,980 | $0 | $0 |
Source: Public Records
Map
Nearby Homes
- 1631 Northview Ln
- 1643 Northview Ln
- 1612 Norwood Dr
- 1608 Norwood Dr
- 1634 Northview Ln
- 1628 Northview Ln
- 1649 Northview Ln
- 1624 Norwood Dr
- 1640 Northview Ln
- 1619 Northview Ln
- 1622 Northview Ln
- 1615 Norwood Dr
- 1609 Norwood Dr
- 1646 Northview Ln
- 1705 Northview Ln
- 1606 Norwood Dr
- 1621 Norwood Dr
- 1630 Norwood Dr
- 1613 Northview Ln
- 1627 Norwood Dr