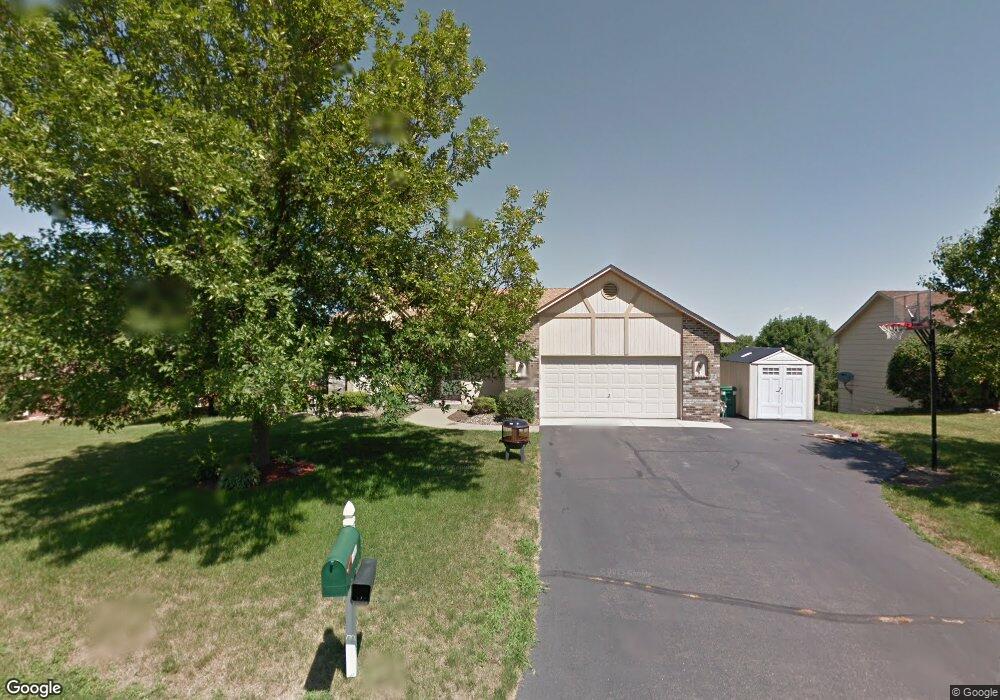
16370 Java Ln Lakeville, MN 55044
Estimated Value: $424,000 - $509,762
5
Beds
3
Baths
2,839
Sq Ft
$167/Sq Ft
Est. Value
About This Home
This home is located at 16370 Java Ln, Lakeville, MN 55044 and is currently estimated at $474,441, approximately $167 per square foot. 16370 Java Ln is a home located in Dakota County with nearby schools including Huddleston Elementary School, Kenwood Trail Middle School, and Lakeville North High School.
Ownership History
Date
Name
Owned For
Owner Type
Purchase Details
Closed on
Sep 16, 2021
Sold by
Patterson Tracey L
Bought by
Wilson Shontel
Current Estimated Value
Home Financials for this Owner
Home Financials are based on the most recent Mortgage that was taken out on this home.
Original Mortgage
$447,051
Outstanding Balance
$406,783
Interest Rate
2.8%
Mortgage Type
VA
Estimated Equity
$67,658
Purchase Details
Closed on
Aug 26, 2019
Sold by
Patterson Lane M
Bought by
Patterson Tracey L
Home Financials for this Owner
Home Financials are based on the most recent Mortgage that was taken out on this home.
Original Mortgage
$295,000
Interest Rate
3%
Mortgage Type
Adjustable Rate Mortgage/ARM
Purchase Details
Closed on
Aug 30, 2001
Sold by
Benson Allen E and Benson Annette L
Bought by
Patterson Lane M and Patterson Tracy L
Create a Home Valuation Report for This Property
The Home Valuation Report is an in-depth analysis detailing your home's value as well as a comparison with similar homes in the area
Home Values in the Area
Average Home Value in this Area
Purchase History
| Date | Buyer | Sale Price | Title Company |
|---|---|---|---|
| Wilson Shontel | $440,000 | Trademark Title Services Inc | |
| Patterson Tracey L | -- | Land Title Inc | |
| Patterson Lane M | $252,900 | -- | |
| Wilson Shontel Shontel | $440,000 | -- |
Source: Public Records
Mortgage History
| Date | Status | Borrower | Loan Amount |
|---|---|---|---|
| Open | Wilson Shontel | $447,051 | |
| Previous Owner | Patterson Tracey L | $295,000 | |
| Closed | Wilson Shontel Shontel | $428,860 |
Source: Public Records
Tax History Compared to Growth
Tax History
| Year | Tax Paid | Tax Assessment Tax Assessment Total Assessment is a certain percentage of the fair market value that is determined by local assessors to be the total taxable value of land and additions on the property. | Land | Improvement |
|---|---|---|---|---|
| 2024 | $5,750 | $492,000 | $90,500 | $401,500 |
| 2023 | $5,750 | $457,700 | $90,200 | $367,500 |
| 2022 | $4,754 | $458,200 | $89,900 | $368,300 |
| 2021 | $5,226 | $405,400 | $73,400 | $332,000 |
| 2020 | $5,390 | $375,100 | $69,900 | $305,200 |
| 2019 | $3,982 | $367,200 | $66,600 | $300,600 |
| 2018 | $3,986 | $326,400 | $63,400 | $263,000 |
| 2017 | $3,870 | $321,100 | $60,300 | $260,800 |
| 2016 | $3,871 | $309,100 | $57,400 | $251,700 |
| 2015 | $3,576 | $284,419 | $53,780 | $230,639 |
| 2014 | -- | $273,955 | $52,008 | $221,947 |
| 2013 | -- | $238,530 | $46,857 | $191,673 |
Source: Public Records
Map
Nearby Homes
- 16357 Java Ln
- 16365 Javari Ct
- 16344 Jatos Cir
- 16193 Jamaica Ave
- 16415 Jaffna Place
- 16045 Oak Shore Dr
- 16765 Jaguar Place
- 16386 Jaffna Place
- 16905 Jalisco Terrace W
- 230 Maple Island Rd
- 101 Oak Shore Dr
- 10025 170th St W
- 16825 Jackpine Trail
- 16557 Iredale Ct
- 17146 Jaybell Ct
- 313 Maple Island Rd
- 9957 171st St W
- 17128 Jonquil Ave
- 16551 Irwinton Cir
- 333 Maple Island Rd