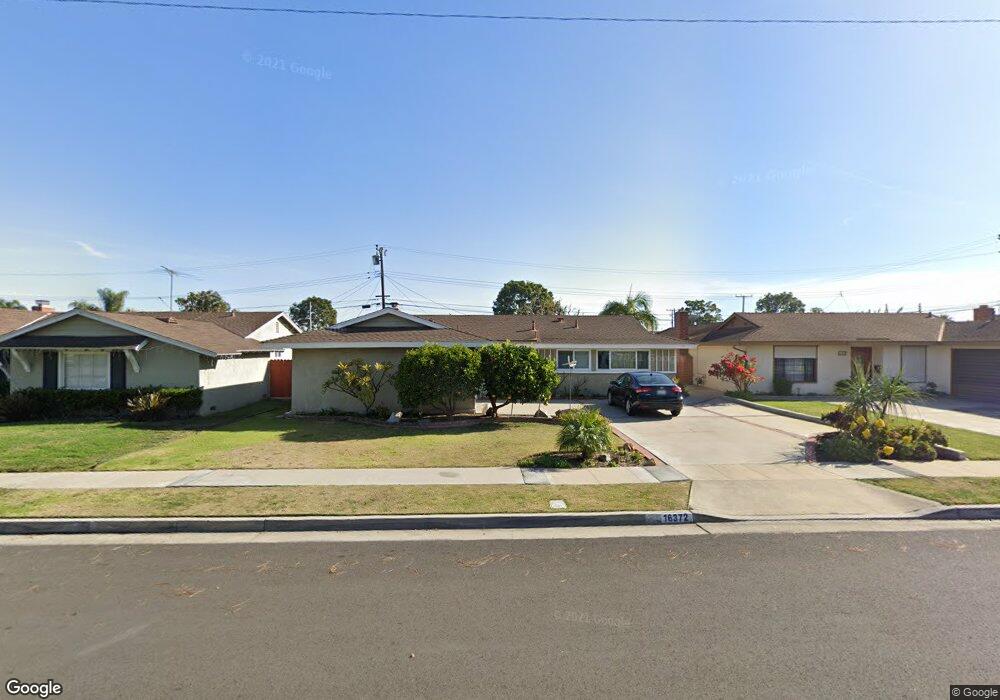
16372 Arlington Ln Huntington Beach, CA 92649
Bolsa Chica-Heil NeighborhoodEstimated Value: $1,072,145 - $1,197,000
3
Beds
2
Baths
1,122
Sq Ft
$999/Sq Ft
Est. Value
About This Home
This home is located at 16372 Arlington Ln, Huntington Beach, CA 92649 and is currently estimated at $1,121,286, approximately $999 per square foot. 16372 Arlington Ln is a home located in Orange County with nearby schools including Village View Elementary School, Marine View Middle, and Marina High School.
Ownership History
Date
Name
Owned For
Owner Type
Purchase Details
Closed on
Jul 7, 2025
Sold by
Nagle Michael
Bought by
Nagle Rachael Ann
Current Estimated Value
Home Financials for this Owner
Home Financials are based on the most recent Mortgage that was taken out on this home.
Original Mortgage
$415,000
Outstanding Balance
$414,303
Interest Rate
6.89%
Mortgage Type
New Conventional
Estimated Equity
$706,983
Purchase Details
Closed on
Jun 17, 2025
Sold by
Wolf Trust and Nagle Rachael Ann
Bought by
Nagle Rachael Ann
Home Financials for this Owner
Home Financials are based on the most recent Mortgage that was taken out on this home.
Original Mortgage
$415,000
Outstanding Balance
$414,303
Interest Rate
6.89%
Mortgage Type
New Conventional
Estimated Equity
$706,983
Purchase Details
Closed on
Oct 3, 2005
Sold by
Wolf Herbert and Wolf Kay N
Bought by
Wolf Herbert and Wolf Kay N
Create a Home Valuation Report for This Property
The Home Valuation Report is an in-depth analysis detailing your home's value as well as a comparison with similar homes in the area
Home Values in the Area
Average Home Value in this Area
Purchase History
| Date | Buyer | Sale Price | Title Company |
|---|---|---|---|
| Nagle Rachael Ann | -- | First American Title | |
| Nagle Rachael Ann | -- | First American Title | |
| Wolf Herbert | -- | -- |
Source: Public Records
Mortgage History
| Date | Status | Borrower | Loan Amount |
|---|---|---|---|
| Open | Nagle Rachael Ann | $415,000 |
Source: Public Records
Tax History Compared to Growth
Tax History
| Year | Tax Paid | Tax Assessment Tax Assessment Total Assessment is a certain percentage of the fair market value that is determined by local assessors to be the total taxable value of land and additions on the property. | Land | Improvement |
|---|---|---|---|---|
| 2025 | $1,037 | $1,080,000 | $1,013,503 | $66,497 |
| 2024 | $1,037 | $65,954 | $29,218 | $36,736 |
| 2023 | $1,009 | $64,661 | $28,645 | $36,016 |
| 2022 | $987 | $63,394 | $28,084 | $35,310 |
| 2021 | $969 | $62,151 | $27,533 | $34,618 |
| 2020 | $958 | $61,514 | $27,250 | $34,264 |
| 2019 | $945 | $60,308 | $26,715 | $33,593 |
| 2018 | $926 | $59,126 | $26,191 | $32,935 |
| 2017 | $911 | $57,967 | $25,677 | $32,290 |
| 2016 | $881 | $56,831 | $25,174 | $31,657 |
| 2015 | $867 | $55,978 | $24,796 | $31,182 |
| 2014 | $848 | $54,882 | $24,310 | $30,572 |
Source: Public Records
Map
Nearby Homes
- 5591 Heil Ave
- 5200 Heil Ave Unit 18
- 5200 Heil Ave Unit 8
- 16444 Bolsa Chica St Unit 137
- 16444 Bolsa Chica St Unit 74
- 16444 Bolsa Chica St Unit 60
- 16444 Bolsa Chica St Unit 16
- 16444 Bolsa Chica St Unit 26
- 16444 Bolsa Chica St Unit 167
- 16444 Bolsa Chica St Unit 21
- 4951 Maui Cir
- 5751 Mangrum Dr
- 16832 Roosevelt Ln
- 16542 Los Verdes Ln
- 16581 Grunion Unit 204
- 16551 Grunion Unit 304
- 16551 Grunion Unit 204
- 5131 Skylark Dr
- 4852 Cabana Dr Unit 202
- 4861 Lago Dr Unit 206
- 16382 Arlington Ln
- 16362 Arlington Ln
- 16371 Bayshore Ln
- 16361 Bayshore Ln
- 16381 Bayshore Ln
- 16352 Arlington Ln
- 16402 Arlington Ln
- 16351 Bayshore Ln
- 16401 Bayshore Ln
- 16371 Arlington Ln
- 16381 Arlington Ln
- 16361 Arlington Ln
- 16342 Arlington Ln
- 16412 Arlington Ln
- 16401 Arlington Ln
- 16351 Arlington Ln
- 16341 Bayshore Ln
- 16411 Bayshore Ln
- 16332 Arlington Ln
- 16341 Arlington Ln