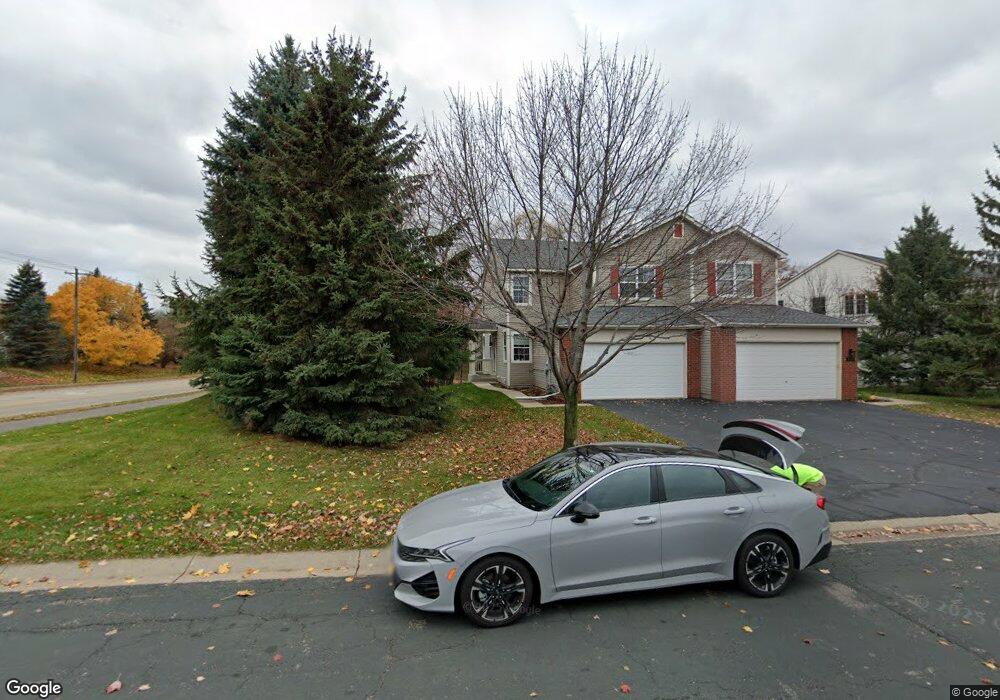
16373 Jamison Path Lakeville, MN 55044
Estimated Value: $350,000 - $429,000
4
Beds
4
Baths
1,882
Sq Ft
$203/Sq Ft
Est. Value
About This Home
This home is located at 16373 Jamison Path, Lakeville, MN 55044 and is currently estimated at $381,482, approximately $202 per square foot. 16373 Jamison Path is a home located in Dakota County with nearby schools including Huddleston Elementary School, Kenwood Trail Middle School, and Lakeville North High School.
Ownership History
Date
Name
Owned For
Owner Type
Purchase Details
Closed on
Dec 9, 2016
Sold by
Sweeney Joseph Patrick
Bought by
Sweeney Joseph Patrick and Estele Frederque Nathalie
Current Estimated Value
Purchase Details
Closed on
Nov 9, 2016
Sold by
Doyle Michele M and Doyle Joseph A
Bought by
Sweeney Joseph P
Purchase Details
Closed on
Dec 21, 2009
Sold by
Richmond Gabriel C and Richmond Taean M
Bought by
Olson Michele M and Olson Justin D
Purchase Details
Closed on
Nov 27, 2006
Sold by
Richmond Steven L and Richmond Kathleen S
Bought by
Richmond Taean M and Richmond Gabriel C
Purchase Details
Closed on
Oct 15, 2004
Sold by
Not Provided
Bought by
Richmond Steven L and Richmond Kathleen S
Purchase Details
Closed on
Jun 25, 2001
Sold by
Town & Country Homes Inc
Bought by
Blough Adam and Loy Catherine
Create a Home Valuation Report for This Property
The Home Valuation Report is an in-depth analysis detailing your home's value as well as a comparison with similar homes in the area
Home Values in the Area
Average Home Value in this Area
Purchase History
| Date | Buyer | Sale Price | Title Company |
|---|---|---|---|
| Sweeney Joseph Patrick | -- | None Available | |
| Sweeney Joseph P | $244,900 | Title One Inc | |
| Olson Michele M | $225,000 | Burnet Title | |
| Richmond Taean M | $233,000 | -- | |
| Richmond Steven L | $235,000 | -- | |
| Rac Closing Services Llc | $23,500 | -- | |
| Blough Adam | $210,424 | -- |
Source: Public Records
Tax History
| Year | Tax Paid | Tax Assessment Tax Assessment Total Assessment is a certain percentage of the fair market value that is determined by local assessors to be the total taxable value of land and additions on the property. | Land | Improvement |
|---|---|---|---|---|
| 2024 | $3,914 | $362,100 | $58,600 | $303,500 |
| 2023 | $3,914 | $361,300 | $58,400 | $302,900 |
| 2022 | $3,438 | $357,000 | $58,200 | $298,800 |
| 2021 | $3,306 | $296,900 | $50,600 | $246,300 |
| 2020 | $3,518 | $276,600 | $48,200 | $228,400 |
| 2019 | $3,137 | $278,400 | $45,900 | $232,500 |
| 2018 | $2,873 | $257,800 | $42,500 | $215,300 |
| 2017 | $2,765 | $233,200 | $39,300 | $193,900 |
| 2016 | $2,640 | $228,800 | $37,500 | $191,300 |
| 2015 | $2,323 | $191,660 | $32,856 | $158,804 |
| 2014 | -- | $175,637 | $31,296 | $144,341 |
| 2013 | -- | $141,738 | $26,414 | $115,324 |
Source: Public Records
Map
Nearby Homes
- 16445 Jarreau Ct
- 16386 Jaffna Place
- 16365 Javari Ct
- 16373 Javari Ct
- 16193 Jamaica Ave
- 16568 Irwindale Way
- 16861 Jasper Path
- 16550 Irwinton Cir
- 16747 Iredale Path
- 9780 170th St W
- 313 Maple Island Rd
- 321 Maple Island Rd
- 16795 Illinois Ave
- 17050 Javelin Ct
- 17141 Jackson Trail
- 16862 Illinois Ave
- 15700 Maple Island Ct
- 16235 Crystal Hills Dr
- 15716 Maple Island Ct
- 16125 Crystal Hills Dr
- 16371 Jamison Path
- 16369 Jamison Path
- 16367 Jamison Path
- 16487 Jarreau Ct
- 16483 Jarreau Ct
- 16481 Jarreau Ct
- 16365 Jamison Path
- 16479 Jarreau Ct
- 16372 Jamison Path
- 10067 166th St W
- 16368 Jamison Path
- 16363 Jamison Path
- 10045 166th St W
- 16366 Jamison Path
- 16475 Jarreau Ct
- 10089 166th St W
- 16364 Jamison Path
- 10023 166th St W
- 16471 Jarreau Ct
- 16359 Jamison Path
Your Personal Tour Guide
Ask me questions while you tour the home.