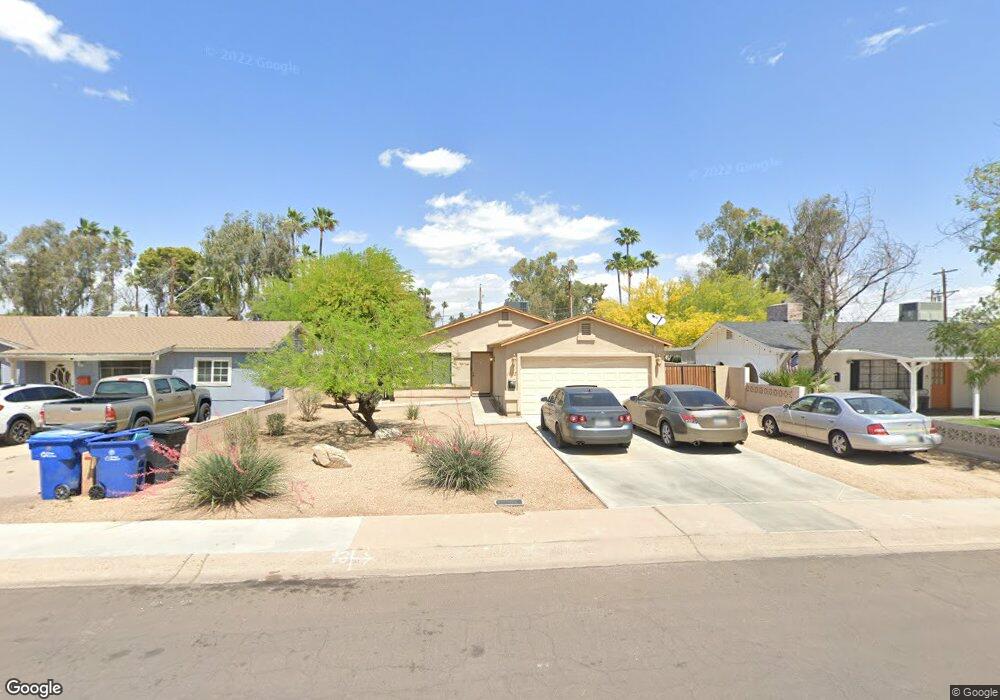
1638 E 12th St Unit 60 Tempe, AZ 85281
Downtown Tempe NeighborhoodEstimated Value: $436,000 - $519,484
3
Beds
2
Baths
1,231
Sq Ft
$400/Sq Ft
Est. Value
About This Home
This home is located at 1638 E 12th St Unit 60, Tempe, AZ 85281 and is currently estimated at $492,121, approximately $399 per square foot. 1638 E 12th St Unit 60 is a home located in Maricopa County with nearby schools including Laird Elementary School, McClintock High School, and New School for the Arts & Academics.
Ownership History
Date
Name
Owned For
Owner Type
Purchase Details
Closed on
Sep 24, 2021
Sold by
Huerta Philip J and Huerta Carmen M
Bought by
Myers Dylan
Current Estimated Value
Home Financials for this Owner
Home Financials are based on the most recent Mortgage that was taken out on this home.
Original Mortgage
$396,000
Outstanding Balance
$361,115
Interest Rate
2.8%
Mortgage Type
New Conventional
Estimated Equity
$131,006
Purchase Details
Closed on
Dec 23, 2009
Sold by
Chase Home Builders Llc
Bought by
Huerta Philip J and Huerta Carmen M
Home Financials for this Owner
Home Financials are based on the most recent Mortgage that was taken out on this home.
Original Mortgage
$140,000
Interest Rate
4.91%
Mortgage Type
New Conventional
Purchase Details
Closed on
Mar 12, 2009
Sold by
Barges Paulette
Bought by
Chase Home Builders Llc
Purchase Details
Closed on
Sep 30, 2005
Sold by
Calderon Edward E and Calderon Marcelina S
Bought by
Barges Paulette
Create a Home Valuation Report for This Property
The Home Valuation Report is an in-depth analysis detailing your home's value as well as a comparison with similar homes in the area
Home Values in the Area
Average Home Value in this Area
Purchase History
| Date | Buyer | Sale Price | Title Company |
|---|---|---|---|
| Myers Dylan | -- | Equity Title Agency Inc | |
| Huerta Philip J | $189,000 | Stewart Title & Trust Of Pho | |
| Chase Home Builders Llc | $59,000 | Stewart Title & Trust Of Pho | |
| Barges Paulette | $50,000 | Chicago Title Insurance Co |
Source: Public Records
Mortgage History
| Date | Status | Borrower | Loan Amount |
|---|---|---|---|
| Open | Myers Dylan | $396,000 | |
| Previous Owner | Huerta Philip J | $140,000 |
Source: Public Records
Tax History Compared to Growth
Tax History
| Year | Tax Paid | Tax Assessment Tax Assessment Total Assessment is a certain percentage of the fair market value that is determined by local assessors to be the total taxable value of land and additions on the property. | Land | Improvement |
|---|---|---|---|---|
| 2025 | $2,674 | $27,606 | -- | -- |
| 2024 | $2,641 | $26,291 | -- | -- |
| 2023 | $2,641 | $40,070 | $8,010 | $32,060 |
| 2022 | $2,522 | $27,950 | $5,590 | $22,360 |
| 2021 | $2,572 | $26,130 | $5,220 | $20,910 |
| 2020 | $2,486 | $24,150 | $4,830 | $19,320 |
| 2019 | $2,438 | $20,600 | $4,120 | $16,480 |
| 2018 | $2,460 | $20,780 | $4,150 | $16,630 |
| 2017 | $2,383 | $19,370 | $3,870 | $15,500 |
| 2016 | $2,515 | $19,560 | $3,910 | $15,650 |
| 2015 | $2,514 | $20,900 | $4,180 | $16,720 |
Source: Public Records
Map
Nearby Homes
- 1622 E 12th St
- 1831 E Apache Blvd Unit 100
- 1831 E Apache Blvd Unit 102
- 1609 E Williams St
- 1871 E Hayden Ln Unit D
- 1887 E Hayden Ln
- 1903 E Hayden Ln
- 906 S Acapulco Ln Unit A
- 1324 E Hall St
- 1886 E Don Carlos Ave Unit 165
- 1886 E Don Carlos Ave Unit 106
- 826 S Casitas Dr Unit A
- 916 S Melody Ln Unit 8
- 816 S Melody Ln
- 1930 E Hayden Ln Unit 110
- 1905 E University Dr Unit C210
- 1905 E University Dr Unit L157
- 1905 E University Dr Unit P162
- 914 S Kenwood Cir
- 920 S Kenwood Cir
- 1638 E 12th St
- 1702 E 12th St
- 1634 E 12th St
- 1706 E 12th St
- 1630 E 12th St
- 1639 E 12th St
- 1710 E 12th St
- 1626 E 12th St
- 1701 E 12th St
- 1635 E 12th St
- 1705 E 12th St
- 1705 E 12th St Unit B
- 1705 E 12th St Unit A
- 1631 E 12th St
- 1714 E 12th St
- 1709 E 12th St Unit B
- 1709 E 12th St Unit B
- 1709 E 12th St
- 1627 E 12th St
- 1713 E 12th St