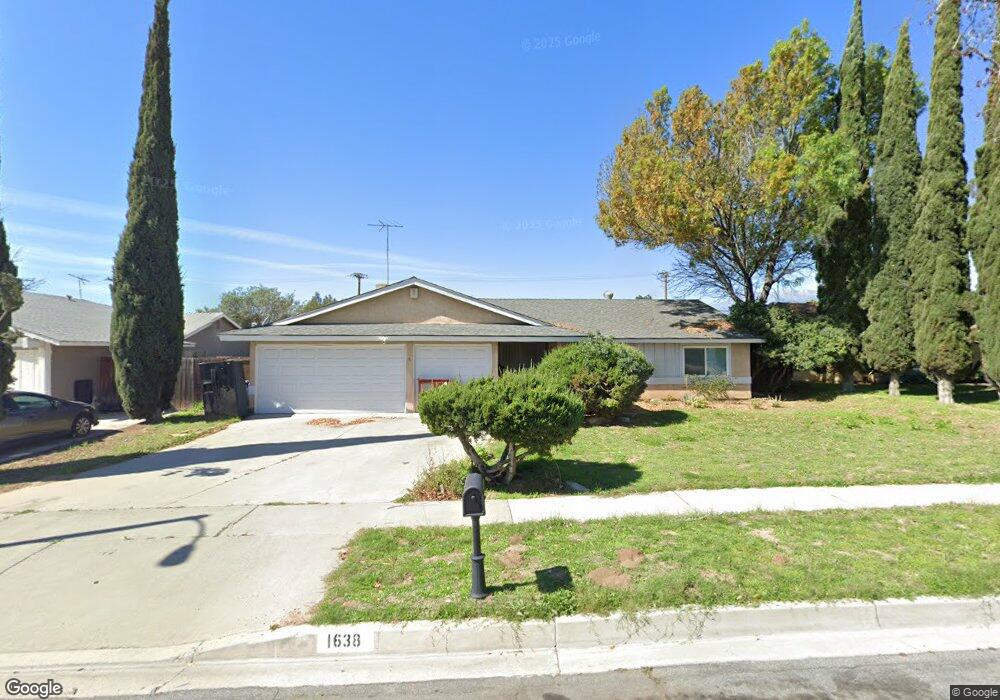
1638 N Yucca Ave Rialto, CA 92376
Estimated Value: $567,094 - $593,000
4
Beds
2
Baths
1,630
Sq Ft
$355/Sq Ft
Est. Value
About This Home
This home is located at 1638 N Yucca Ave, Rialto, CA 92376 and is currently estimated at $579,274, approximately $355 per square foot. 1638 N Yucca Ave is a home located in San Bernardino County with nearby schools including Elizabeth T. Hughbanks Elementary School, Kolb Middle School, and Wilmer Amina Carter High School.
Ownership History
Date
Name
Owned For
Owner Type
Purchase Details
Closed on
Mar 25, 2022
Sold by
Chen Li Nina
Bought by
Li Junguang
Current Estimated Value
Purchase Details
Closed on
Mar 24, 2022
Sold by
Chen Li Nina and Chen Junguang
Bought by
Li Nina Chen and Li Junguang
Purchase Details
Closed on
Oct 19, 2017
Sold by
Liu Nan
Bought by
Li Nina Chen and Li Junguang
Purchase Details
Closed on
Jul 6, 2011
Sold by
The Bank Of New York Mellon
Bought by
Liu Nan
Purchase Details
Closed on
Feb 8, 2011
Sold by
White Karon A
Bought by
The Bank Of New York Mellon and The Bank Of New York
Create a Home Valuation Report for This Property
The Home Valuation Report is an in-depth analysis detailing your home's value as well as a comparison with similar homes in the area
Home Values in the Area
Average Home Value in this Area
Purchase History
| Date | Buyer | Sale Price | Title Company |
|---|---|---|---|
| Li Junguang | -- | Fidelity National Title | |
| Li Nina Chen | -- | Fidelity National Title | |
| Li Nina Chen | -- | None Available | |
| Liu Nan | $151,000 | Fidelity National Title | |
| The Bank Of New York Mellon | $144,000 | None Available |
Source: Public Records
Tax History Compared to Growth
Tax History
| Year | Tax Paid | Tax Assessment Tax Assessment Total Assessment is a certain percentage of the fair market value that is determined by local assessors to be the total taxable value of land and additions on the property. | Land | Improvement |
|---|---|---|---|---|
| 2025 | $3,970 | $189,667 | $50,243 | $139,424 |
| 2024 | $3,970 | $185,948 | $49,258 | $136,690 |
| 2023 | $2,847 | $182,302 | $48,292 | $134,010 |
| 2022 | $2,635 | $178,727 | $47,345 | $131,382 |
| 2021 | $2,621 | $175,223 | $46,417 | $128,806 |
| 2020 | $3,435 | $173,426 | $45,941 | $127,485 |
| 2019 | $2,574 | $170,025 | $45,040 | $124,985 |
| 2018 | $2,617 | $166,691 | $44,157 | $122,534 |
| 2017 | $2,472 | $163,422 | $43,291 | $120,131 |
| 2016 | $2,834 | $160,217 | $42,442 | $117,775 |
| 2015 | $2,234 | $157,810 | $41,804 | $116,006 |
| 2014 | $2,746 | $154,719 | $40,985 | $113,734 |
Source: Public Records
Map
Nearby Homes
- 6795 Fillmore Ave
- 19449 Anaconda St
- 19487 Chaparral St
- 763 W Virginia St
- 1760 N Vista Ave
- 1861 N Lilac Ave
- 1839 N Millard Ave
- 301 W Easton St
- 19244 Casmalia St
- 178 W Walnut Ave Unit D
- 160 W Cascade Dr
- 19538 Cheshire St
- 1789 Falcon St
- 1148 Thunderchief Ln
- 1231 Yeager Ave
- 1074 W Casmalia St
- 1031 N Lilac Ave
- 935 W Wabash St
- 264 W Jackson St
- 242 W Jackson St
- 1650 N Yucca Ave
- 1626 N Yucca Ave
- 1662 N Yucca Ave
- 1614 N Yucca Ave
- 1635 N Yucca Ave
- 1647 N Yucca Ave
- 1623 N Yucca Ave
- 1629 N Fillmore Ave
- 663 W Mariana St
- 1641 N Fillmore Ave
- 1617 N Fillmore Ave
- 1674 N Yucca Ave
- 1613 N Yucca Ave
- 657 W Mariana St
- 1605 N Fillmore Ave
- 1665 N Fillmore Ave
- 1636 N Iris Ave
- 1648 N Iris Ave
- 1624 N Iris Ave
- 1686 N Yucca Ave