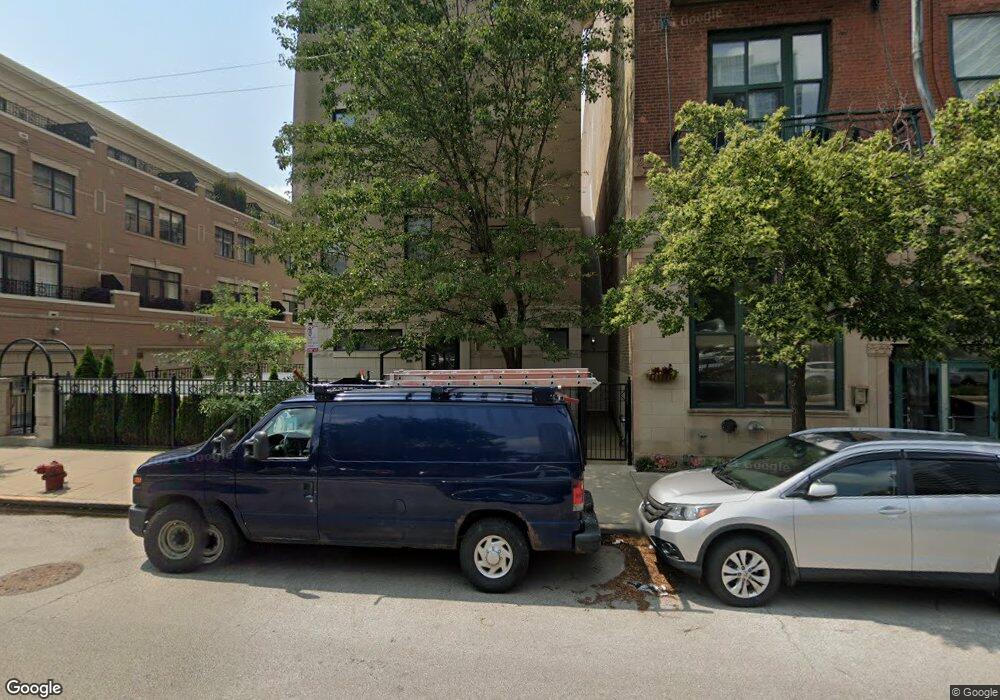
1638 S Indiana Ave Unit 5 Chicago, IL 60616
Central Station NeighborhoodEstimated Value: $840,371 - $1,026,000
3
Beds
3
Baths
2,463
Sq Ft
$376/Sq Ft
Est. Value
About This Home
This home is located at 1638 S Indiana Ave Unit 5, Chicago, IL 60616 and is currently estimated at $925,093, approximately $375 per square foot. 1638 S Indiana Ave Unit 5 is a home located in Cook County with nearby schools including South Loop Elementary School, Wendell Phillips Academy High School, and Perspectives Chtr - Joslin Campus.
Ownership History
Date
Name
Owned For
Owner Type
Purchase Details
Closed on
Jul 28, 2011
Sold by
Wharton Kevin V and Downes Wharton Kate
Bought by
Pandit Shailendra and Pandit Bulbul
Current Estimated Value
Home Financials for this Owner
Home Financials are based on the most recent Mortgage that was taken out on this home.
Original Mortgage
$417,000
Outstanding Balance
$288,994
Interest Rate
4.59%
Mortgage Type
New Conventional
Estimated Equity
$636,099
Purchase Details
Closed on
Dec 2, 2004
Sold by
Kensington Park Ii Llc
Bought by
Wharton Kevin V and Downes Wharton Kate
Home Financials for this Owner
Home Financials are based on the most recent Mortgage that was taken out on this home.
Original Mortgage
$447,200
Interest Rate
5.37%
Mortgage Type
Unknown
Create a Home Valuation Report for This Property
The Home Valuation Report is an in-depth analysis detailing your home's value as well as a comparison with similar homes in the area
Home Values in the Area
Average Home Value in this Area
Purchase History
| Date | Buyer | Sale Price | Title Company |
|---|---|---|---|
| Pandit Shailendra | $530,000 | Stewart Title Company | |
| Wharton Kevin V | $559,500 | Near North Natl Title Corp |
Source: Public Records
Mortgage History
| Date | Status | Borrower | Loan Amount |
|---|---|---|---|
| Open | Pandit Shailendra | $417,000 | |
| Previous Owner | Wharton Kevin V | $447,200 | |
| Closed | Wharton Kevin V | $55,900 |
Source: Public Records
Tax History Compared to Growth
Tax History
| Year | Tax Paid | Tax Assessment Tax Assessment Total Assessment is a certain percentage of the fair market value that is determined by local assessors to be the total taxable value of land and additions on the property. | Land | Improvement |
|---|---|---|---|---|
| 2024 | $13,904 | $78,000 | $16,913 | $61,087 |
| 2023 | $13,531 | $69,000 | $13,608 | $55,392 |
| 2022 | $13,531 | $69,000 | $13,608 | $55,392 |
| 2021 | $13,245 | $69,000 | $13,608 | $55,392 |
| 2020 | $16,664 | $77,907 | $11,178 | $66,729 |
| 2019 | $16,325 | $84,682 | $11,178 | $73,504 |
| 2018 | $16,049 | $84,682 | $11,178 | $73,504 |
| 2017 | $14,965 | $72,895 | $9,234 | $63,661 |
| 2016 | $14,100 | $72,895 | $9,234 | $63,661 |
| 2015 | $12,877 | $72,895 | $9,234 | $63,661 |
| 2014 | $10,983 | $61,766 | $8,262 | $53,504 |
| 2013 | $10,755 | $61,766 | $8,262 | $53,504 |
Source: Public Records
Map
Nearby Homes
- 1632 S Indiana Ave Unit 403
- 1616 S Indiana Ave Unit B3
- 1631 S Michigan Ave Unit 604
- 1631 S Michigan Ave Unit 312
- 1631 S Michigan Ave Unit 410
- 1617 S Michigan Ave Unit 202
- 1600 S Indiana Ave Unit 908
- 1600 S Indiana Ave Unit 1503
- 1600 S Indiana Ave Unit P84
- 1601 S Indiana Ave Unit 503
- 1727 S Indiana Ave Unit 214
- 1601 S Michigan Ave Unit 306
- 1601 S Michigan Ave Unit 108
- 1620 S Michigan Ave Unit 619
- 1629 S Prairie Ave Unit 2103
- 1629 S Prairie Ave Unit 2405
- 1629 S Prairie Ave Unit 801
- 1629 S Prairie Ave Unit GU70
- 1550 S Indiana Ave Unit P31
- 1720 S Michigan Ave Unit 2903
- 1638 S Indiana Ave
- 1638 S Indiana Ave
- 1638 S Indiana Ave Unit 4
- 1638 S Indiana Ave
- 1638 S Indiana Ave
- 1638 S Indiana Ave Unit 3
- 1642 S Indiana Ave
- 1644 S Indiana Ave
- 1646 S Indiana Ave
- 1648 S Indiana Ave
- 1650 S Indiana Ave
- 1652 S Indiana Ave
- 1712 S Indiana Ave
- 1714 S Indiana Ave
- 1710 S Indiana Ave
- 1632 S Indiana Ave Unit PU32
- 1632 S Indiana Ave Unit GU16
- 1632 S Indiana Ave Unit 703
- 1632 S Indiana Ave Unit 505
- 1632 S Indiana Ave Unit 305