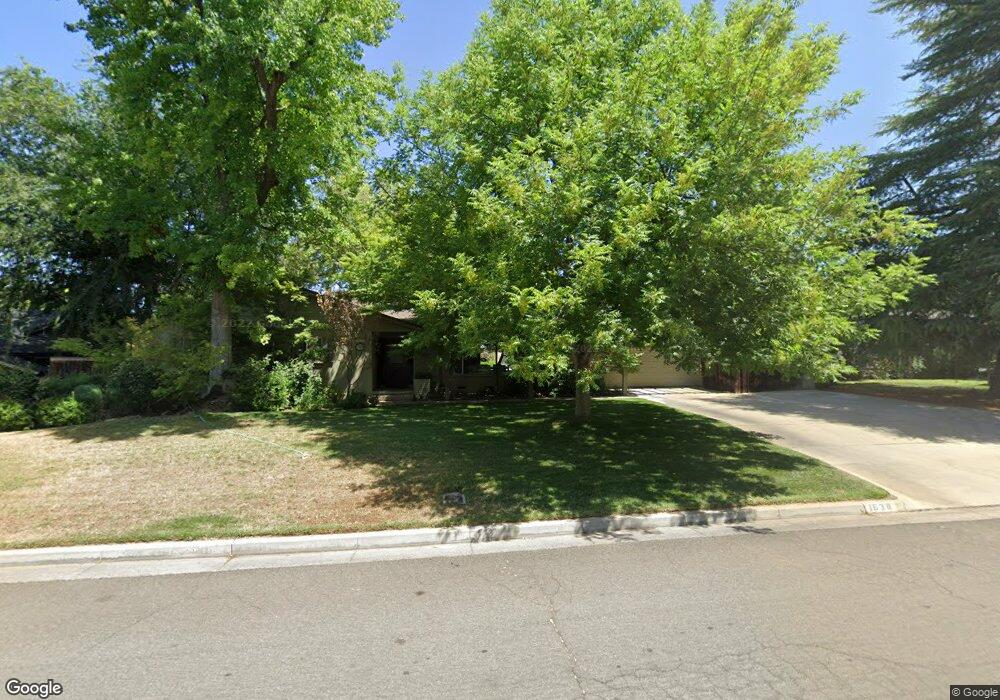
1638 W San Bruno Ave Fresno, CA 93711
Bullard NeighborhoodEstimated Value: $476,184 - $559,000
3
Beds
2
Baths
1,787
Sq Ft
$289/Sq Ft
Est. Value
About This Home
This home is located at 1638 W San Bruno Ave, Fresno, CA 93711 and is currently estimated at $516,546, approximately $289 per square foot. 1638 W San Bruno Ave is a home located in Fresno County with nearby schools including Gibson Elementary School, Tenaya Middle School, and Bullard High School.
Ownership History
Date
Name
Owned For
Owner Type
Purchase Details
Closed on
Mar 22, 2011
Sold by
Solis Rafael
Bought by
Solis Rafael and Waddell Solis Donna
Current Estimated Value
Purchase Details
Closed on
Sep 1, 2000
Sold by
Craig Singer and Zylka Charlotte
Bought by
Solis Rafael
Home Financials for this Owner
Home Financials are based on the most recent Mortgage that was taken out on this home.
Original Mortgage
$140,000
Interest Rate
7.72%
Purchase Details
Closed on
Jan 7, 1999
Sold by
Craig Singer and Zyika Charlotte
Bought by
Singer Craig and Singer Charlotte Zylka
Home Financials for this Owner
Home Financials are based on the most recent Mortgage that was taken out on this home.
Original Mortgage
$141,100
Interest Rate
6.66%
Purchase Details
Closed on
Apr 17, 1995
Sold by
Weld Don D
Bought by
Singer Craig and Singer Charlotte Zyika
Home Financials for this Owner
Home Financials are based on the most recent Mortgage that was taken out on this home.
Original Mortgage
$140,600
Interest Rate
8.51%
Purchase Details
Closed on
Aug 25, 1994
Sold by
Weld Cathy A
Bought by
Weld Don D
Create a Home Valuation Report for This Property
The Home Valuation Report is an in-depth analysis detailing your home's value as well as a comparison with similar homes in the area
Home Values in the Area
Average Home Value in this Area
Purchase History
| Date | Buyer | Sale Price | Title Company |
|---|---|---|---|
| Solis Rafael | -- | None Available | |
| Solis Rafael | $175,000 | First American Title Co | |
| Singer Craig | -- | Fidelity National Title Co | |
| Singer Craig | $148,000 | Central Title Company | |
| Weld Don D | -- | -- |
Source: Public Records
Mortgage History
| Date | Status | Borrower | Loan Amount |
|---|---|---|---|
| Closed | Solis Rafael | $140,000 | |
| Previous Owner | Singer Craig | $141,100 | |
| Previous Owner | Singer Craig | $140,600 |
Source: Public Records
Tax History Compared to Growth
Tax History
| Year | Tax Paid | Tax Assessment Tax Assessment Total Assessment is a certain percentage of the fair market value that is determined by local assessors to be the total taxable value of land and additions on the property. | Land | Improvement |
|---|---|---|---|---|
| 2025 | $2,611 | $220,727 | $67,796 | $152,931 |
| 2023 | $2,611 | $212,158 | $65,164 | $146,994 |
| 2022 | $2,523 | $207,999 | $63,887 | $144,112 |
| 2021 | $2,452 | $203,922 | $62,635 | $141,287 |
| 2020 | $2,441 | $201,832 | $61,993 | $139,839 |
| 2019 | $2,344 | $197,876 | $60,778 | $137,098 |
| 2018 | $2,292 | $193,997 | $59,587 | $134,410 |
| 2017 | $2,251 | $190,194 | $58,419 | $131,775 |
| 2016 | $2,174 | $186,466 | $57,274 | $129,192 |
| 2015 | $2,140 | $183,666 | $56,414 | $127,252 |
| 2014 | $2,096 | $180,069 | $55,309 | $124,760 |
Source: Public Records
Map
Nearby Homes
- 1582 W San Jose Ave
- 5180 N Channing Way
- 1720 W Barstow Ave
- 1685 W Robinwood Ln
- 1473 W Scott Ave
- 2044 W San Bruno Ave
- 1647 W Wrenwood Ave
- 5124 N Via Trevi
- 2059 W Barstow Ave
- 5386 N Fruit Ave
- 5125 N Via Amore
- 5072 N Forkner Ave
- 5088 N Forkner Ave
- 1110 W Fairmont Ave
- 2190 W Via Cipressi
- 4939 N Fruit Ave
- 5375 N Forkner Ave
- 5630 N El Adobe Dr
- 1530 W Roberts Ave
- 709 W Alamos Ave
- 1650 W San Bruno Ave
- 1618 W San Bruno Ave
- 1639 W San Ramon Ave
- 1651 W San Ramon Ave
- 1619 W San Ramon Ave
- 1641 W San Bruno Ave
- 1621 W San Bruno Ave
- 1668 W San Bruno Ave
- 1669 W San Ramon Ave
- 1647 W San Bruno Ave
- 1671 W San Bruno Ave
- 5221 N Teilman Ave
- 5272 N Teilman Ave
- 5256 N Teilman Ave
- 1684 W San Bruno Ave
- 1636 W San Ramon Ave
- 5240 N Teilman Ave
- 1587 W San Ramon Ave
- 1685 W San Ramon Ave
- 1620 W San Ramon Ave