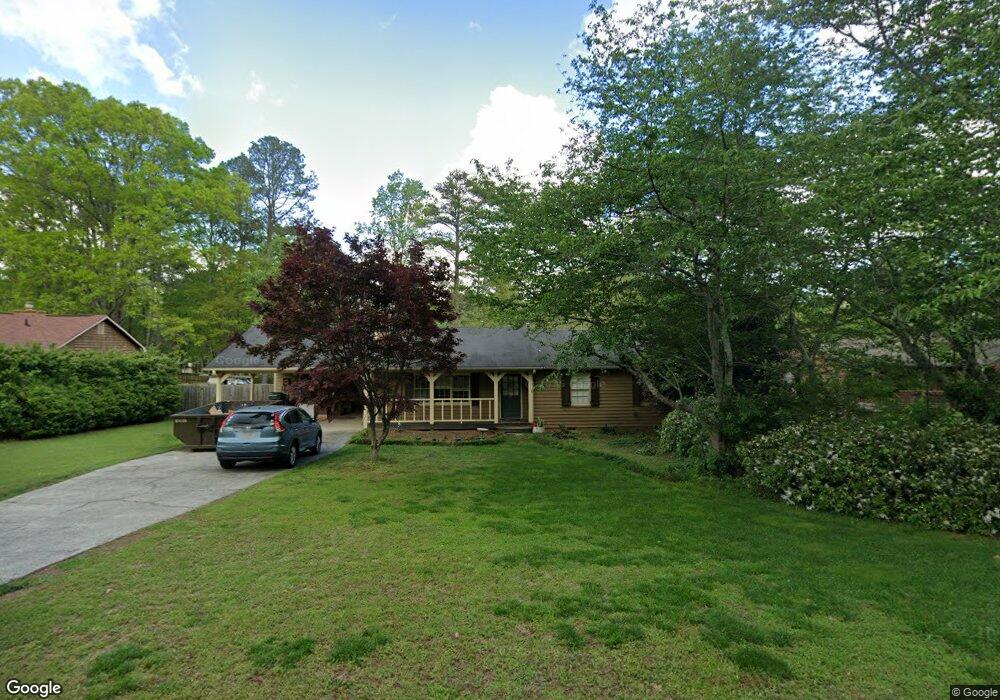
1639 Bellchase Dr SW Unit 42 Marietta, GA 30064
West Cobb NeighborhoodEstimated Value: $306,718 - $344,000
3
Beds
2
Baths
1,286
Sq Ft
$253/Sq Ft
Est. Value
About This Home
This home is located at 1639 Bellchase Dr SW Unit 42, Marietta, GA 30064 and is currently estimated at $325,430, approximately $253 per square foot. 1639 Bellchase Dr SW Unit 42 is a home located in Cobb County with nearby schools including Dowell Elementary School, Lovinggood Middle School, and Hillgrove High School.
Ownership History
Date
Name
Owned For
Owner Type
Purchase Details
Closed on
Jul 19, 2019
Sold by
Gill Jonathan
Bought by
Harper Molly C
Current Estimated Value
Home Financials for this Owner
Home Financials are based on the most recent Mortgage that was taken out on this home.
Original Mortgage
$201,286
Outstanding Balance
$176,272
Interest Rate
3.8%
Mortgage Type
FHA
Estimated Equity
$149,158
Purchase Details
Closed on
Apr 9, 2018
Sold by
Meaders Colin J
Bought by
Gill Jonathan and Gill Anna Kate
Home Financials for this Owner
Home Financials are based on the most recent Mortgage that was taken out on this home.
Original Mortgage
$179,450
Interest Rate
4.46%
Mortgage Type
New Conventional
Purchase Details
Closed on
May 11, 2000
Sold by
Burke Sandra M
Bought by
Meaders Collin J
Home Financials for this Owner
Home Financials are based on the most recent Mortgage that was taken out on this home.
Original Mortgage
$71,725
Interest Rate
8.2%
Mortgage Type
New Conventional
Create a Home Valuation Report for This Property
The Home Valuation Report is an in-depth analysis detailing your home's value as well as a comparison with similar homes in the area
Home Values in the Area
Average Home Value in this Area
Purchase History
| Date | Buyer | Sale Price | Title Company |
|---|---|---|---|
| Harper Molly C | $205,000 | -- | |
| Gill Jonathan | $185,000 | -- | |
| Meaders Collin J | $75,500 | -- |
Source: Public Records
Mortgage History
| Date | Status | Borrower | Loan Amount |
|---|---|---|---|
| Open | Harper Molly C | $201,286 | |
| Previous Owner | Gill Jonathan | $179,450 | |
| Previous Owner | Meaders Collin J | $71,725 |
Source: Public Records
Tax History Compared to Growth
Tax History
| Year | Tax Paid | Tax Assessment Tax Assessment Total Assessment is a certain percentage of the fair market value that is determined by local assessors to be the total taxable value of land and additions on the property. | Land | Improvement |
|---|---|---|---|---|
| 2024 | $2,662 | $112,116 | $34,000 | $78,116 |
| 2023 | $2,031 | $108,084 | $10,000 | $98,084 |
| 2022 | $2,422 | $100,240 | $10,000 | $90,240 |
| 2021 | $1,871 | $75,088 | $10,000 | $65,088 |
| 2020 | $1,871 | $75,088 | $10,000 | $65,088 |
| 2019 | $1,799 | $59,260 | $10,000 | $49,260 |
| 2018 | $1,078 | $51,368 | $10,000 | $41,368 |
| 2017 | $1,054 | $51,368 | $10,000 | $41,368 |
| 2016 | $688 | $34,616 | $10,000 | $24,616 |
| 2015 | $790 | $26,820 | $12,160 | $14,660 |
| 2014 | $797 | $26,820 | $0 | $0 |
Source: Public Records
Map
Nearby Homes
- 2673 Altony Dr SW
- 1884 Dovonshire Rd SW
- 1518 Sage Ridge Dr
- 1313 Bustling Ln SW
- 1311 Bustling Ln SW
- 1853 Edington Rd SW
- 1234 Wynford Colony SW
- 2418 Southern Oak Dr SW
- 3001 Ashland Ct SW
- 2375 Westport Cir SW Unit 2
- 1209 Wilkes Way SW Unit 1
- 2261 Byron Ct SW
- 3006 Coffman Ct SW
- 2866 Wynford Dr SW Unit 2
- 3354 Hannah Ct
- 1765 Dew Place
- 1237 Wynford Woods SW
- 1567 Vine Leaf Dr
- 1214 Bonshaw Trail
- 1639 Bellchase Dr SW
- 1649 Bellchase Dr SW
- 1629 Bellchase Dr SW Unit 3
- 1659 Bellchase Dr SW
- 1619 Bellchase Dr SW
- 1640 Bellchase Dr SW Unit 3
- 1650 Bellchase Dr SW
- 2587 Fairfield Dr SW
- 2597 Fairfield Dr SW
- 0 Bellchase Dr SW Unit 8506691
- 0 Bellchase Dr SW Unit 9057836
- 0 Bellchase Dr SW Unit 8774713
- 0 Bellchase Dr SW Unit 7162115
- 0 Bellchase Dr SW
- 1620 Bellchase Dr SW
- 1669 Bellchase Dr SW
- 2607 Fairfield Dr SW
- 1660 Bellchase Dr SW
- 2577 Fairfield Dr SW Unit 3
- 2617 Fairfield Dr SW