
Landlord's Agent in 2017
Mary Tremonte
Baird Warner
(630) 624-6574
76 Total Sales

Estimated Value: $395,000 - $443,000
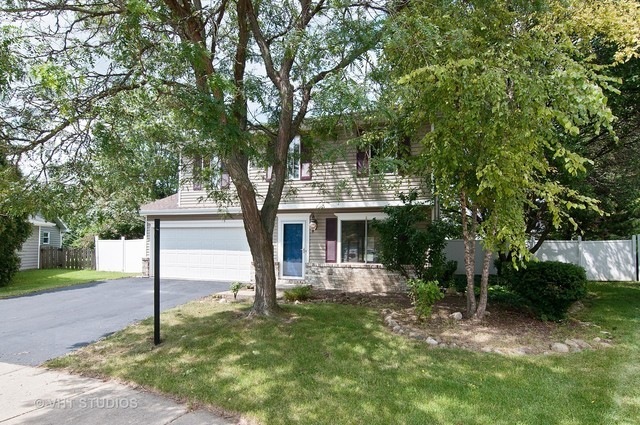
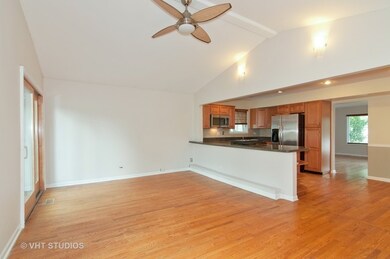
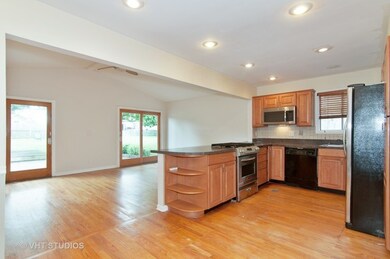
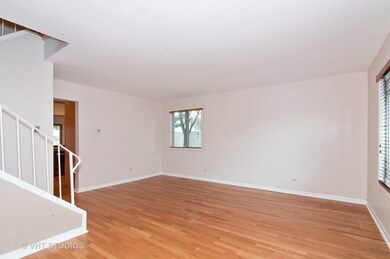
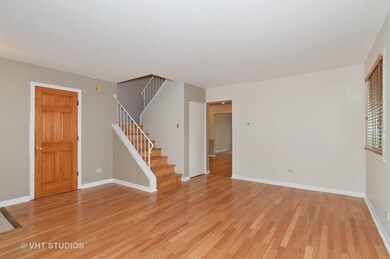
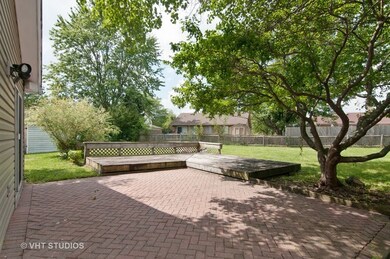
Great Cul-de Sac location and Naperville schools with this two story home that offers 4 bedrooms and 2.5 bathrooms. Hardwood floors on first and second floor. Large updated kitchen opens up to family room with vaulted ceilings. Sliding glass door with large fenced yard. First floor laundry room. Approx. 1944 square feet of living space. Master bedroom has full bathroom. All bedrooms have hardwood floors. A $500 non-refundable pet deposit is required.
Last Agent to Rent the Property
Baird & Warner License #475114154 Listed on: 11/06/2017
| Date | Buyer | Sale Price | Title Company |
|---|---|---|---|
| The Bank Of New York Mellon | -- | None Available |
| Date | Status | Borrower | Loan Amount |
|---|---|---|---|
| Open | Vu Henry | $180,000 | |
| Previous Owner | Mrazek Kelly J | $206,500 | |
| Previous Owner | Mrazek Timothy J | $191,900 |
| Date | Event | Price | Change | Sq Ft Price |
|---|---|---|---|---|
| 11/24/2017 11/24/17 | Rented | $1,700 | 0.0% | -- |
| 11/08/2017 11/08/17 | Off Market | $1,700 | -- | -- |
| 11/06/2017 11/06/17 | For Rent | $1,700 | +17.2% | -- |
| 12/07/2015 12/07/15 | Rented | $1,450 | -19.4% | -- |
| 11/07/2015 11/07/15 | Under Contract | -- | -- | -- |
| 11/04/2015 11/04/15 | For Rent | $1,800 | 0.0% | -- |
| 10/14/2014 10/14/14 | Sold | $138,000 | 0.0% | $71 / Sq Ft |
| 09/10/2014 09/10/14 | Pending | -- | -- | -- |
| 08/25/2014 08/25/14 | Off Market | $138,000 | -- | -- |
| 08/24/2014 08/24/14 | For Sale | $154,900 | -- | $80 / Sq Ft |
| Year | Tax Paid | Tax Assessment Tax Assessment Total Assessment is a certain percentage of the fair market value that is determined by local assessors to be the total taxable value of land and additions on the property. | Land | Improvement |
|---|---|---|---|---|
| 2024 | $7,927 | $104,257 | $28,524 | $75,733 |
| 2023 | $7,613 | $93,680 | $25,630 | $68,050 |
| 2022 | $6,995 | $83,410 | $22,640 | $60,770 |
| 2021 | $6,823 | $80,430 | $21,830 | $58,600 |
| 2020 | $6,906 | $80,430 | $21,830 | $58,600 |
| 2019 | $6,682 | $76,490 | $20,760 | $55,730 |
| 2018 | $5,944 | $67,300 | $18,430 | $48,870 |
| 2017 | $5,857 | $65,010 | $17,800 | $47,210 |
| 2016 | $5,769 | $62,390 | $17,080 | $45,310 |
| 2015 | $5,730 | $59,240 | $16,220 | $43,020 |
| 2014 | $5,168 | $57,870 | $15,710 | $42,160 |
| 2013 | $5,116 | $58,270 | $15,820 | $42,450 |
Landlord's Agent in 2017
Mary Tremonte
Baird Warner
(630) 624-6574
76 Total Sales
S
Seller's Agent in 2015
Stephanie Cronin
Baird & Warner
Y
Buyer's Agent in 2015
Yalan Pai
The McDonald Group
Seller's Agent in 2014
Steve Malik
RE/MAX
(630) 369-3000
2 in this area
96 Total Sales
N
Buyer's Agent in 2014
Non Member
NON MEMBER
Source: Midwest Real Estate Data (MRED)
MLS Number: MRD09794648
APN: 07-31-308-046
Disclaimer: Certain information contained herein is derived from information provided by parties other than Homes.com. All information provided is deemed reliable, but is not guaranteed to be accurate and should be independently verified.
![]() Based on information submitted to the MLS GRID. All data is obtained from various sources and may not have been verified by broker or MLS GRID. Supplied Open House Information is subject to change without notice. All information should be independently reviewed and verified for accuracy. Properties may or may not be listed by the office/agent presenting the information. Some IDX listings have been excluded from this website.
Based on information submitted to the MLS GRID. All data is obtained from various sources and may not have been verified by broker or MLS GRID. Supplied Open House Information is subject to change without notice. All information should be independently reviewed and verified for accuracy. Properties may or may not be listed by the office/agent presenting the information. Some IDX listings have been excluded from this website.
The Digital Millennium Copyright Act of 1998, 17 U.S.C. § 512 (the “DMCA”) provides recourse for copyright owners who believe that material appearing on the Internet infringes their rights under U.S. copyright law. If you believe in good faith that any content or material made available in connection with our website or services infringes your copyright, you (or your agent) may send us a notice requesting that the content or material be removed, or access to it blocked.
Notices must be sent in writing by email to DMCAnotice@MLSGrid.com.
The DMCA requires that your notice of alleged copyright infringement include the following information:
(1) description of the copyrighted work that is the subject of claimed infringement;
(2) description of the alleged infringing content and information sufficient to permit us to locate the content;
(3) contact information for you, including your address, telephone number and email address;
(4) a statement by you that you have a good faith belief that the content in the manner complained of is not authorized by the copyright owner, or its agent, or by the operation of any law;
(5) a statement by you, signed under penalty of perjury, that the information in the notification is accurate and that you have the authority to enforce the copyrights that are claimed to be infringed; and
(6) a physical or electronic signature of the copyright owner or a person authorized to act on the copyright owner’s behalf. Failure to include all of the above information may result in the delay of the processing of your complaint.