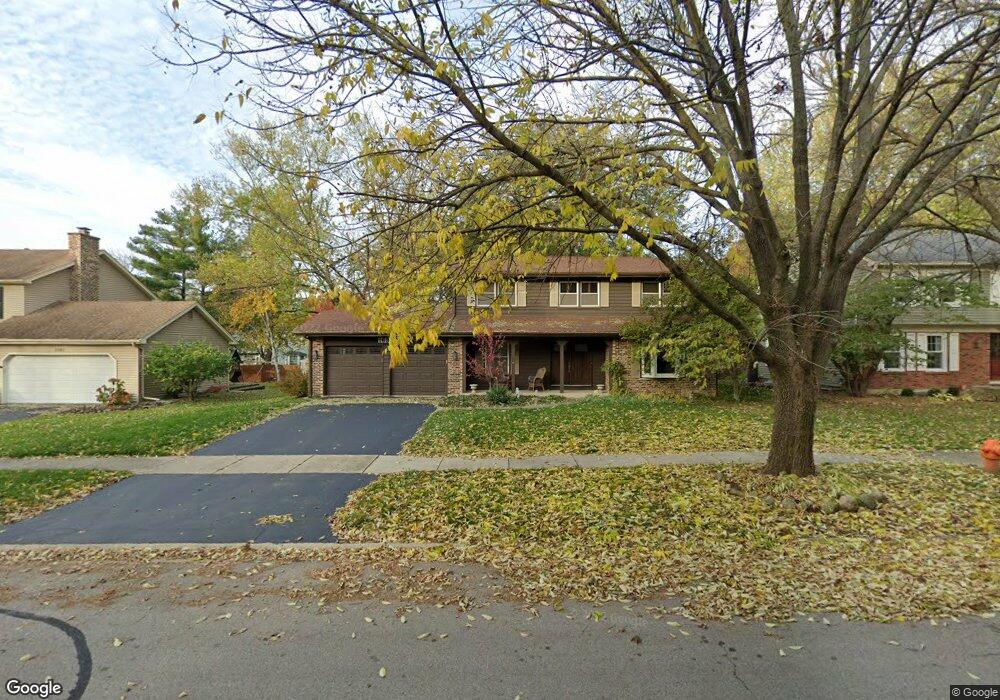
1639 Indian Knoll Rd Naperville, IL 60565
Signal Point NeighborhoodEstimated Value: $601,126 - $613,000
4
Beds
3
Baths
2,125
Sq Ft
$285/Sq Ft
Est. Value
About This Home
This home is located at 1639 Indian Knoll Rd, Naperville, IL 60565 and is currently estimated at $605,782, approximately $285 per square foot. 1639 Indian Knoll Rd is a home located in DuPage County with nearby schools including Scott Elementary School, Madison Jr High School, and Naperville Central High School.
Ownership History
Date
Name
Owned For
Owner Type
Purchase Details
Closed on
Dec 18, 2019
Sold by
Matteson David M and Matteson Angela J
Bought by
Matteson Angela J
Current Estimated Value
Home Financials for this Owner
Home Financials are based on the most recent Mortgage that was taken out on this home.
Original Mortgage
$248,000
Outstanding Balance
$217,780
Interest Rate
3.4%
Mortgage Type
New Conventional
Estimated Equity
$388,002
Purchase Details
Closed on
Sep 14, 2007
Sold by
Yurco Nancy E and Nancy E Yurco Revocable Trust
Bought by
Matteson David M and Matteson Angela J
Home Financials for this Owner
Home Financials are based on the most recent Mortgage that was taken out on this home.
Original Mortgage
$304,000
Interest Rate
6.66%
Mortgage Type
Purchase Money Mortgage
Create a Home Valuation Report for This Property
The Home Valuation Report is an in-depth analysis detailing your home's value as well as a comparison with similar homes in the area
Home Values in the Area
Average Home Value in this Area
Purchase History
| Date | Buyer | Sale Price | Title Company |
|---|---|---|---|
| Matteson Angela J | -- | Attorney | |
| Matteson David M | $380,000 | Ctic |
Source: Public Records
Mortgage History
| Date | Status | Borrower | Loan Amount |
|---|---|---|---|
| Open | Matteson Angela J | $248,000 | |
| Closed | Matteson David M | $304,000 |
Source: Public Records
Tax History Compared to Growth
Tax History
| Year | Tax Paid | Tax Assessment Tax Assessment Total Assessment is a certain percentage of the fair market value that is determined by local assessors to be the total taxable value of land and additions on the property. | Land | Improvement |
|---|---|---|---|---|
| 2024 | $9,144 | $157,255 | $69,566 | $87,689 |
| 2023 | $8,806 | $143,520 | $63,490 | $80,030 |
| 2022 | $8,425 | $136,180 | $60,240 | $75,940 |
| 2021 | $8,116 | $131,030 | $57,960 | $73,070 |
| 2020 | $7,942 | $128,680 | $56,920 | $71,760 |
| 2019 | $7,709 | $123,120 | $54,460 | $68,660 |
| 2018 | $7,711 | $123,120 | $54,460 | $68,660 |
| 2017 | $7,554 | $118,960 | $52,620 | $66,340 |
| 2016 | $7,401 | $114,660 | $50,720 | $63,940 |
| 2015 | $7,351 | $107,970 | $47,760 | $60,210 |
| 2014 | $7,392 | $105,310 | $45,700 | $59,610 |
| 2013 | $7,281 | $105,560 | $45,810 | $59,750 |
Source: Public Records
Map
Nearby Homes
- 1717 Drake Ct
- 456 Timber Trail Ct
- 1323 Auburn Ave
- 1340 Auburn Ave
- 621 Bourbon Ct
- 431 Orleans Ave
- 1449 Whitespire Ct Unit 5104
- 517 Sheffield Rd
- 158 E Bailey Rd Unit F
- 144 E Bailey Rd Unit L
- 138 E Bailey Rd Unit M
- 128 E Bailey Rd Unit G
- 1704 Kenyon Dr
- 1519 77th St
- 8S452 Bell Dr
- 1721 S Washington St Unit 1721
- 1751 S Washington St Unit 1
- 816 Spindletree Ave
- 302 Carriage Hill Rd
- 805 Potomac Ave
- 1647 Indian Knoll Rd
- 1624 Indian Trail Dr
- 1634 Indian Knoll Rd
- 1646 Indian Knoll Rd
- 1619 Indian Knoll Rd
- 1620 Indian Trail Dr
- 1628 Indian Trail Dr
- 1703 Indian Knoll Rd
- 1616 Indian Trail Dr
- 1700 Indian Knoll Rd Unit 4
- 1704 Indian Trail Dr
- 1709 Indian Knoll Rd
- 1706 Indian Knoll Rd
- 1612 Indian Trail Dr
- 1611 Indian Knoll Rd
- 1708 Indian Trail Dr
- 910 Knoll Dr
- 1715 Indian Knoll Rd
- 1637 Harris Ln
- 1621 Indian Trail Dr