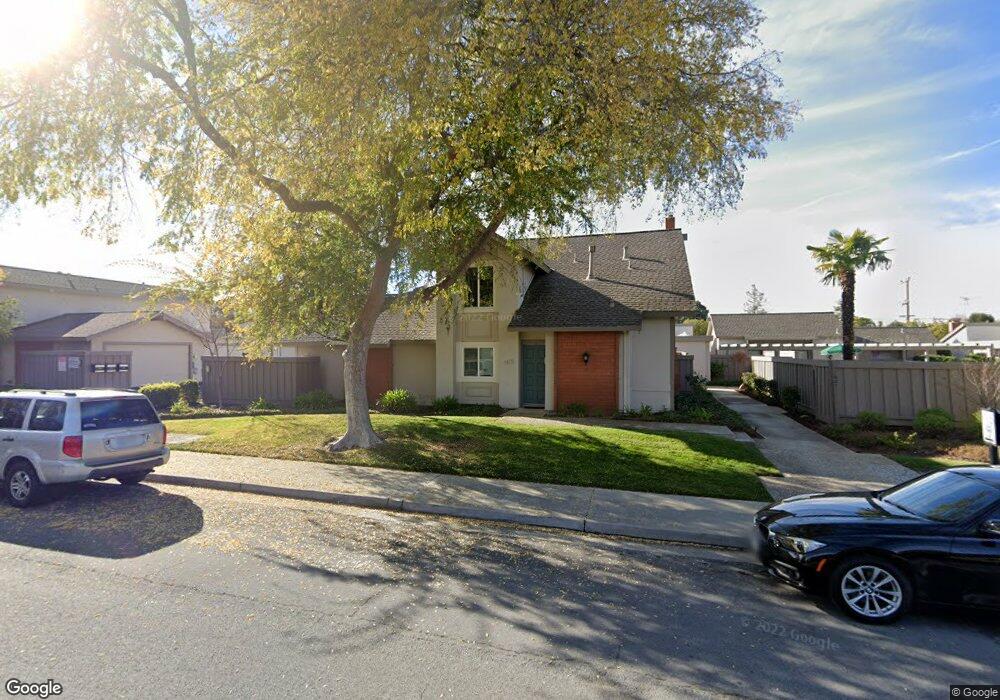
1639 New Brunswick Ave Unit 22 Sunnyvale, CA 94087
Estimated Value: $1,598,709 - $1,704,000
3
Beds
3
Baths
1,522
Sq Ft
$1,095/Sq Ft
Est. Value
About This Home
This home is located at 1639 New Brunswick Ave Unit 22, Sunnyvale, CA 94087 and is currently estimated at $1,667,177, approximately $1,095 per square foot. 1639 New Brunswick Ave Unit 22 is a home located in Santa Clara County with nearby schools including West Valley Elementary School, Cupertino Middle School, and Homestead High School.
Ownership History
Date
Name
Owned For
Owner Type
Purchase Details
Closed on
Dec 15, 2021
Sold by
Chang Chisung Simon and Shen Elaine Hweiwen
Bought by
Chang Chisung Simon and Shen Elaine Hweiwen
Current Estimated Value
Purchase Details
Closed on
Feb 18, 2011
Sold by
Chang Chisung Simon and Shen Elaine Hweiwen
Bought by
Shen Elaine Hweiwen and Chang Chisung Simon
Home Financials for this Owner
Home Financials are based on the most recent Mortgage that was taken out on this home.
Original Mortgage
$399,400
Outstanding Balance
$256,141
Interest Rate
3.5%
Mortgage Type
New Conventional
Estimated Equity
$1,411,036
Purchase Details
Closed on
Mar 21, 2001
Sold by
Kolker Richard A and Kolker Cecelia
Bought by
Chang Chisung Simon and Shen Elaine Hweiwen
Home Financials for this Owner
Home Financials are based on the most recent Mortgage that was taken out on this home.
Original Mortgage
$448,400
Interest Rate
7.12%
Create a Home Valuation Report for This Property
The Home Valuation Report is an in-depth analysis detailing your home's value as well as a comparison with similar homes in the area
Home Values in the Area
Average Home Value in this Area
Purchase History
| Date | Buyer | Sale Price | Title Company |
|---|---|---|---|
| Chang Chisung Simon | -- | None Available | |
| Shen Elaine Hweiwen | -- | Stewart Title Of California | |
| Chang Chisung Simon | $560,500 | Chicago Title Co |
Source: Public Records
Mortgage History
| Date | Status | Borrower | Loan Amount |
|---|---|---|---|
| Open | Shen Elaine Hweiwen | $399,400 | |
| Closed | Chang Chisung Simon | $448,400 |
Source: Public Records
Tax History Compared to Growth
Tax History
| Year | Tax Paid | Tax Assessment Tax Assessment Total Assessment is a certain percentage of the fair market value that is determined by local assessors to be the total taxable value of land and additions on the property. | Land | Improvement |
|---|---|---|---|---|
| 2025 | $9,641 | $844,570 | $422,208 | $422,362 |
| 2024 | $9,641 | $828,011 | $413,930 | $414,081 |
| 2023 | $9,592 | $811,776 | $405,814 | $405,962 |
| 2022 | $9,759 | $795,859 | $397,857 | $398,002 |
| 2021 | $9,595 | $780,255 | $390,056 | $390,199 |
| 2020 | $9,486 | $772,255 | $386,057 | $386,198 |
| 2019 | $9,280 | $757,114 | $378,488 | $378,626 |
| 2018 | $9,069 | $742,269 | $371,067 | $371,202 |
| 2017 | $9,025 | $727,716 | $363,792 | $363,924 |
| 2016 | $8,767 | $713,448 | $356,659 | $356,789 |
| 2015 | $8,717 | $702,732 | $351,302 | $351,430 |
| 2014 | $8,506 | $688,967 | $344,421 | $344,546 |
Source: Public Records
Map
Nearby Homes
- 10837 N Stelling Rd
- 10715 Grapnel Place
- 10683 Pebble Place
- 20676 Celeste Cir Unit 71
- 20666 Celeste Cir Unit 59
- 1768 Karameos Ct
- 1014 W Homestead Rd
- 974 Pocatello Ave
- 543 Cashmere Ct
- 125 Connemara Way Unit 3
- 125 Connemara Way Unit 98
- 10405 Mary Ave
- 1507 Dominion Ave
- 10461 Mary Ave Unit 73
- 21035 Lauretta Dr
- 1262 Riesling Terrace
- 141 Carlisle Way
- 1308 Yarmouth Terrace
- 1243 E Fremont Terrace
- 22081 Caroline Dr
- 1643 New Brunswick Ave
- 1635 New Brunswick Ave
- 1647 New Brunswick Ave
- 1645 New Brunswick Ave
- 1631 New Brunswick Ave
- 1633 New Brunswick Ave Unit 27
- 1649 New Brunswick Ave
- 1655 New Brunswick Ave
- 1627 New Brunswick Ave Unit 30
- 1651 New Brunswick Ave
- 1650 Manitoba Dr
- 1646 Manitoba Dr
- 1625 New Brunswick Ave
- 1654 Manitoba Dr
- 1642 Manitoba Dr
- 1629 New Brunswick Ave
- 1659 New Brunswick Ave
- 1623 New Brunswick Ave Unit 32
- 1658 Manitoba Dr
- 1621 New Brunswick Ave