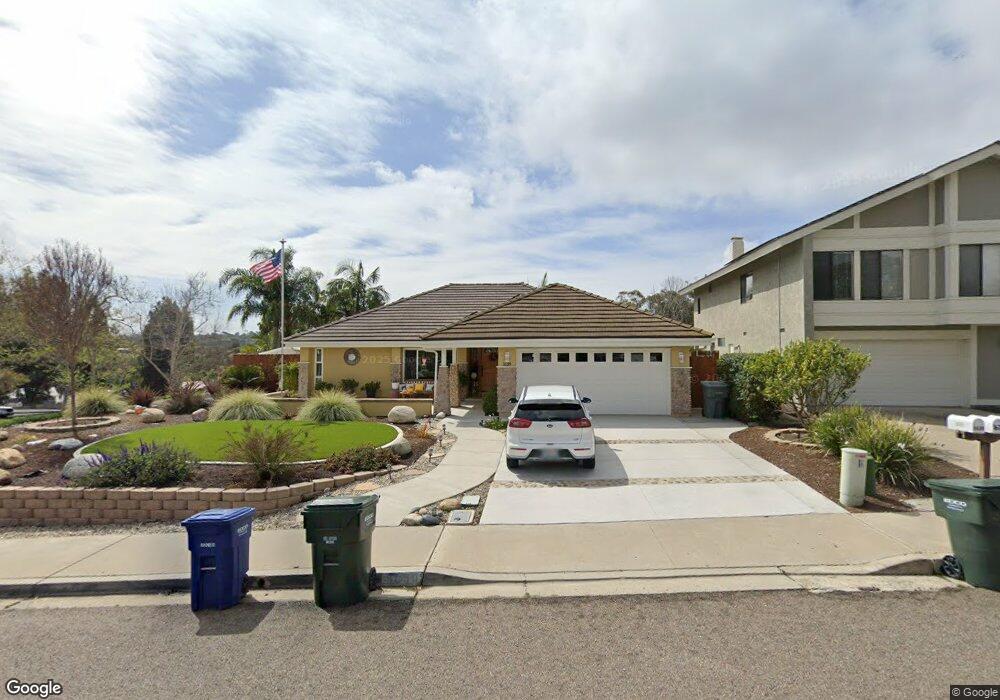
1639 Valleda Ln Encinitas, CA 92024
Central Encinitas NeighborhoodEstimated Value: $1,632,223 - $1,722,000
3
Beds
2
Baths
1,766
Sq Ft
$952/Sq Ft
Est. Value
About This Home
This home is located at 1639 Valleda Ln, Encinitas, CA 92024 and is currently estimated at $1,680,556, approximately $951 per square foot. 1639 Valleda Ln is a home located in San Diego County with nearby schools including Flora Vista Elementary, Diegueno Middle School, and La Costa Canyon High School.
Ownership History
Date
Name
Owned For
Owner Type
Purchase Details
Closed on
Nov 9, 2016
Sold by
Kopp Michael and Kopp Theresa
Bought by
Kopp Michael Edward and Kopp Theresa Joann
Current Estimated Value
Purchase Details
Closed on
Dec 20, 2012
Sold by
Kopp Michael E and Kopp Theresa J
Bought by
Kopp Michael and Kopp Theresa
Home Financials for this Owner
Home Financials are based on the most recent Mortgage that was taken out on this home.
Original Mortgage
$237,000
Outstanding Balance
$163,427
Interest Rate
3.27%
Mortgage Type
New Conventional
Estimated Equity
$1,517,129
Purchase Details
Closed on
Mar 5, 1999
Sold by
Kopp Theresa J
Bought by
Kopp Michael E and Kopp Theresa J
Home Financials for this Owner
Home Financials are based on the most recent Mortgage that was taken out on this home.
Original Mortgage
$161,900
Interest Rate
6.84%
Purchase Details
Closed on
Oct 4, 1993
Sold by
Kopp Michael E
Bought by
Kopp Theresa J
Purchase Details
Closed on
Apr 7, 1992
Create a Home Valuation Report for This Property
The Home Valuation Report is an in-depth analysis detailing your home's value as well as a comparison with similar homes in the area
Home Values in the Area
Average Home Value in this Area
Purchase History
| Date | Buyer | Sale Price | Title Company |
|---|---|---|---|
| Kopp Michael Edward | -- | None Available | |
| Kopp Michael | -- | Chicago Title Company | |
| Kopp Michael E | -- | Fidelity National Title Co | |
| Kopp Theresa J | -- | Southland Title Corporation | |
| -- | $220,000 | -- |
Source: Public Records
Mortgage History
| Date | Status | Borrower | Loan Amount |
|---|---|---|---|
| Open | Kopp Michael | $237,000 | |
| Closed | Kopp Michael E | $161,900 |
Source: Public Records
Tax History
| Year | Tax Paid | Tax Assessment Tax Assessment Total Assessment is a certain percentage of the fair market value that is determined by local assessors to be the total taxable value of land and additions on the property. | Land | Improvement |
|---|---|---|---|---|
| 2025 | $5,205 | $447,229 | $229,870 | $217,359 |
| 2024 | $5,205 | $438,461 | $225,363 | $213,098 |
| 2023 | $5,037 | $429,865 | $220,945 | $208,920 |
| 2022 | $4,903 | $421,437 | $216,613 | $204,824 |
| 2021 | $4,807 | $413,174 | $212,366 | $200,808 |
| 2020 | $4,718 | $408,938 | $210,189 | $198,749 |
| 2019 | $4,627 | $400,920 | $206,068 | $194,852 |
| 2018 | $4,554 | $393,060 | $202,028 | $191,032 |
| 2017 | $4,477 | $385,354 | $198,067 | $187,287 |
| 2016 | $4,344 | $377,799 | $194,184 | $183,615 |
| 2015 | $4,256 | $372,125 | $191,268 | $180,857 |
| 2014 | $4,148 | $364,837 | $187,522 | $177,315 |
Source: Public Records
Map
Nearby Homes
- 1642 Blossom Field Way
- 1617 Blossom Field Way
- 1733 Gentle Breeze Ln
- 1709 Edgefield Ln
- 1693 Honeysuckle Ct
- 1105 Catania Ct Unit 201
- 804 & 814 Clark Ave
- 3736 38 Via Rancho Michelle
- 200 202 Neptune Ave
- 772 Conestoga Ct
- 250 258 Hillcrest Dr
- 1517 Shields Ave
- 1971 Azure Way
- 2072 Wandering Rd
- 1402 Village View Rd
- 824 Glen Arbor Dr
- 1986 Azure Way Unit 107
- 1825 Hummock Ln
- 350 N El Camino Real Unit 78s
- 350 N El Camino Real Unit 72
Your Personal Tour Guide
Ask me questions while you tour the home.