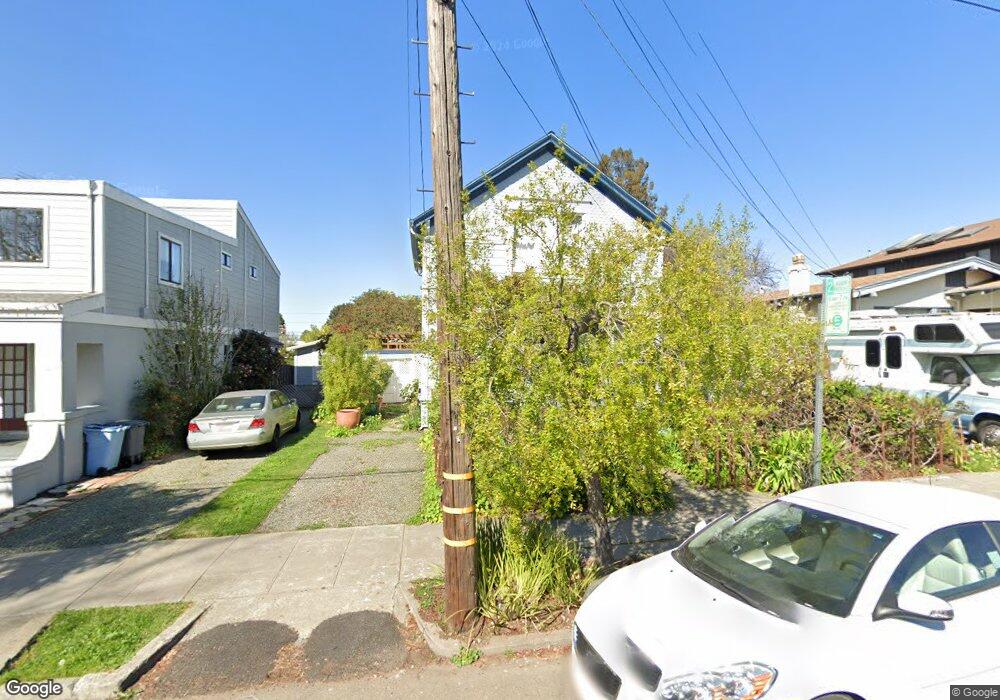
1639 Virginia St Berkeley, CA 94703
North Berkeley NeighborhoodEstimated Value: $1,370,929 - $2,142,000
3
Beds
2
Baths
1,860
Sq Ft
$888/Sq Ft
Est. Value
About This Home
This home is located at 1639 Virginia St, Berkeley, CA 94703 and is currently estimated at $1,651,982, approximately $888 per square foot. 1639 Virginia St is a home located in Alameda County with nearby schools including Berkeley Arts Magnet at Whittier School, Ruth Acty Elementary, and Thousand Oaks Elementary School.
Ownership History
Date
Name
Owned For
Owner Type
Purchase Details
Closed on
Aug 26, 2019
Sold by
Monrad Philip C and Molly Sullivan Living Trust
Bought by
Nicholson Isaac S
Current Estimated Value
Purchase Details
Closed on
Dec 20, 2013
Sold by
Sullivan Mildred
Bought by
Sullivan Mildred and The Molly Sullivan Living Trus
Purchase Details
Closed on
May 4, 2004
Sold by
Sullivan Mildred and Molly Sullivan Living Trust
Bought by
Sullivan Mildred
Home Financials for this Owner
Home Financials are based on the most recent Mortgage that was taken out on this home.
Original Mortgage
$283,500
Interest Rate
5.77%
Mortgage Type
New Conventional
Purchase Details
Closed on
Nov 26, 2002
Sold by
Sullivan Mildred
Bought by
Sullivan Mildred and Molly Sullivan Living Trust
Purchase Details
Closed on
Dec 28, 1995
Sold by
Levy Albert R
Bought by
Sullivan Mildred
Create a Home Valuation Report for This Property
The Home Valuation Report is an in-depth analysis detailing your home's value as well as a comparison with similar homes in the area
Home Values in the Area
Average Home Value in this Area
Purchase History
| Date | Buyer | Sale Price | Title Company |
|---|---|---|---|
| Nicholson Isaac S | $652,500 | Chicago Title Company | |
| Sullivan Mildred | -- | None Available | |
| Sullivan Mildred | -- | Fidelity National Title Co | |
| Sullivan Mildred | -- | -- | |
| Sullivan Mildred | -- | -- |
Source: Public Records
Mortgage History
| Date | Status | Borrower | Loan Amount |
|---|---|---|---|
| Previous Owner | Sullivan Mildred | $283,500 |
Source: Public Records
Tax History
| Year | Tax Paid | Tax Assessment Tax Assessment Total Assessment is a certain percentage of the fair market value that is determined by local assessors to be the total taxable value of land and additions on the property. | Land | Improvement |
|---|---|---|---|---|
| 2025 | $5,375 | $131,140 | $109,970 | $28,170 |
| 2024 | $5,375 | $128,431 | $107,814 | $27,617 |
| 2023 | $5,165 | $132,776 | $105,700 | $27,076 |
| 2022 | $4,935 | $123,173 | $103,628 | $26,545 |
| 2021 | $4,897 | $120,621 | $101,596 | $26,025 |
| 2020 | $4,494 | $126,313 | $100,555 | $25,758 |
| 2019 | $4,369 | $126,023 | $98,583 | $27,440 |
| 2018 | $4,241 | $123,552 | $96,650 | $26,902 |
| 2017 | $4,061 | $121,129 | $94,755 | $26,374 |
| 2016 | $3,806 | $118,755 | $92,898 | $25,857 |
| 2015 | $3,727 | $116,971 | $91,502 | $25,469 |
| 2014 | $3,594 | $114,680 | $89,710 | $24,970 |
Source: Public Records
Map
Nearby Homes
- 1564 Sacramento St
- 1482 Lincoln St
- 1813 Sacramento St
- 1512 Hearst Ave Unit 1512
- 1436 Delaware St
- 1411 Hearst Ave Unit 2
- 1609 Bonita Ave Unit 3
- 1609 Bonita Ave Unit 5
- 1610 Milvia St
- 1425 Martin Luther King jr Way
- 2015 Delaware St
- 2015 Delaware St Unit A
- 2118 California St
- 2218 -2222 Grant St
- 1322 Virginia St
- 1360 Acton St
- 2012 Rose St
- 1207 Francisco St
- 1207 Francisco St Unit 2
- 1809 Hopkins St
- 1641 Virginia St
- 1635 Virginia St
- 1643 Virginia St
- 1625 Virginia St
- 1645 Virginia St
- 1623 Virginia St
- 1668 Lincoln St
- 1660 Lincoln St
- 1672 Lincoln St
- 1636 McGee Ave
- 1654 Lincoln St
- 1647 Virginia St
- 1676 Lincoln St
- 1619 Virginia St
- 1644 Lincoln St
- 1634 McGee Ave
- 1628 Virginia St
- 1630 Virginia St
- 1626 Virginia St
- 1640 Lincoln St
Your Personal Tour Guide
Ask me questions while you tour the home.