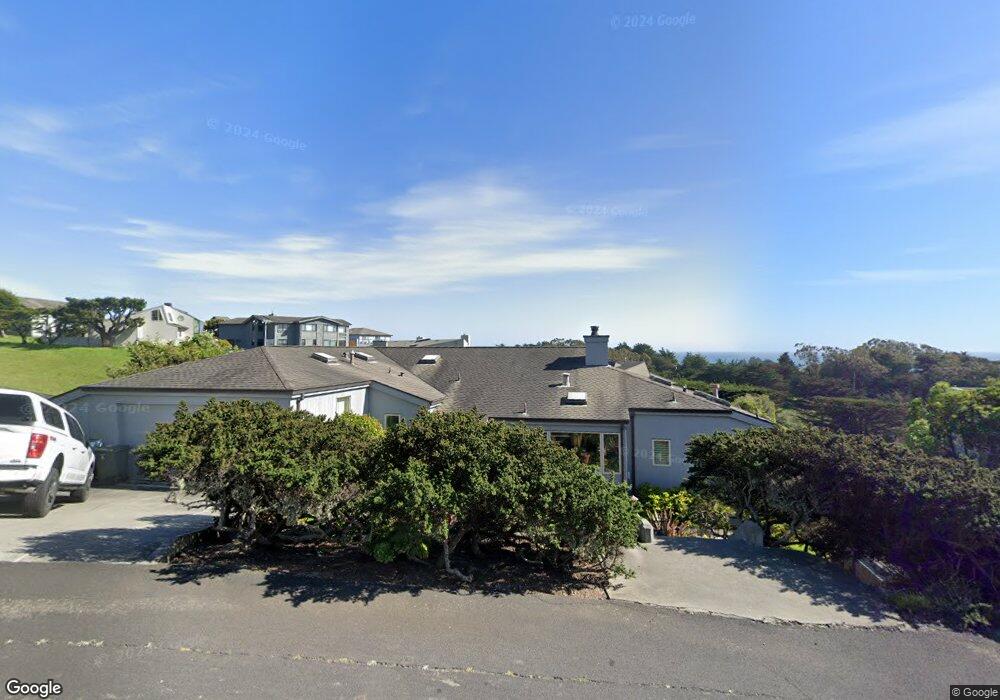
164 Cypress Loop Bodega Bay, CA 94923
Estimated Value: $1,414,000 - $2,140,000
4
Beds
4
Baths
2,686
Sq Ft
$636/Sq Ft
Est. Value
About This Home
This home is located at 164 Cypress Loop, Bodega Bay, CA 94923 and is currently estimated at $1,707,773, approximately $635 per square foot. 164 Cypress Loop is a home with nearby schools including Bodega Bay Elementary School and Tomales High School.
Ownership History
Date
Name
Owned For
Owner Type
Purchase Details
Closed on
Sep 8, 2005
Sold by
Henley Mary Lou
Bought by
Henley Mary Lou and Mary Lou Henley 2005 Revocable
Current Estimated Value
Purchase Details
Closed on
Dec 26, 2003
Sold by
Hulse Jeff
Bought by
Henley Mary Lou
Home Financials for this Owner
Home Financials are based on the most recent Mortgage that was taken out on this home.
Original Mortgage
$544,000
Outstanding Balance
$227,173
Interest Rate
4.37%
Mortgage Type
Construction
Estimated Equity
$1,480,600
Purchase Details
Closed on
Nov 15, 1999
Sold by
Farrell Thomas J and Farrell Evelyn I
Bought by
Hulse Jeff and Henley Mary Lou
Home Financials for this Owner
Home Financials are based on the most recent Mortgage that was taken out on this home.
Original Mortgage
$100,000
Interest Rate
7.82%
Create a Home Valuation Report for This Property
The Home Valuation Report is an in-depth analysis detailing your home's value as well as a comparison with similar homes in the area
Home Values in the Area
Average Home Value in this Area
Purchase History
| Date | Buyer | Sale Price | Title Company |
|---|---|---|---|
| Henley Mary Lou | -- | -- | |
| Henley Mary Lou | -- | First American Title Co | |
| Hulse Jeff | $131,000 | First American Title Co |
Source: Public Records
Mortgage History
| Date | Status | Borrower | Loan Amount |
|---|---|---|---|
| Open | Henley Mary Lou | $544,000 | |
| Closed | Hulse Jeff | $100,000 |
Source: Public Records
Tax History
| Year | Tax Paid | Tax Assessment Tax Assessment Total Assessment is a certain percentage of the fair market value that is determined by local assessors to be the total taxable value of land and additions on the property. | Land | Improvement |
|---|---|---|---|---|
| 2025 | $8,766 | $768,650 | $201,336 | $567,314 |
| 2024 | $8,766 | $753,580 | $197,389 | $556,191 |
| 2023 | $8,766 | $738,805 | $193,519 | $545,286 |
| 2022 | $8,495 | $724,320 | $189,725 | $534,595 |
| 2021 | $8,572 | $710,118 | $186,005 | $524,113 |
| 2020 | $8,591 | $702,837 | $184,098 | $518,739 |
| 2019 | $8,501 | $689,057 | $180,489 | $508,568 |
| 2018 | $8,333 | $675,547 | $176,950 | $498,597 |
| 2017 | $8,137 | $662,302 | $173,481 | $488,821 |
| 2016 | $8,014 | $649,317 | $170,080 | $479,237 |
| 2015 | -- | $639,565 | $167,526 | $472,039 |
| 2014 | -- | $627,038 | $164,245 | $462,793 |
Source: Public Records
Map
Nearby Homes
- 1513 Sea Way
- 150 Cypress Loop
- 1536 Sea Way
- 190 Starboard Ct
- 2025 Dubloon Ct
- 315 Mainsail Dr
- 1968 Sea Way
- 221 Condor Ct
- 21002 Heron Dr
- 301 Sanderling Ct
- 153 Harbor View Way
- 424 Loon Ct
- 20690 Mockingbird Rd
- 6083 California 1
- 2100 California 1
- 590 Swan Dr
- 140 Kent Ave
- 1235 Bay View St
- 1011 Sea Eagle Loop
- 1534 Ranch Rd
- 176 Cypress Loop
- 167 Cypress Loop
- 142 Poppy Ct
- 161 Starboard Ct
- 188 Cypress Loop
- 155 Cypress Loop
- 155 Starboard Ct
- 171 Starboard Ct
- 130 Poppy Ct
- 141 Cypress Loop
- 181 Starboard Ct
- 88 Cypress Loop
- 1583 Sea Way
- 136 Cypress Loop
- 1537 Sea Way
- 1595 Sea Way Unit 275
- 145 Starboard Ct
- 1529 Sea Way
- 133 Cypress Loop
- 122 Poppy Ct
Your Personal Tour Guide
Ask me questions while you tour the home.