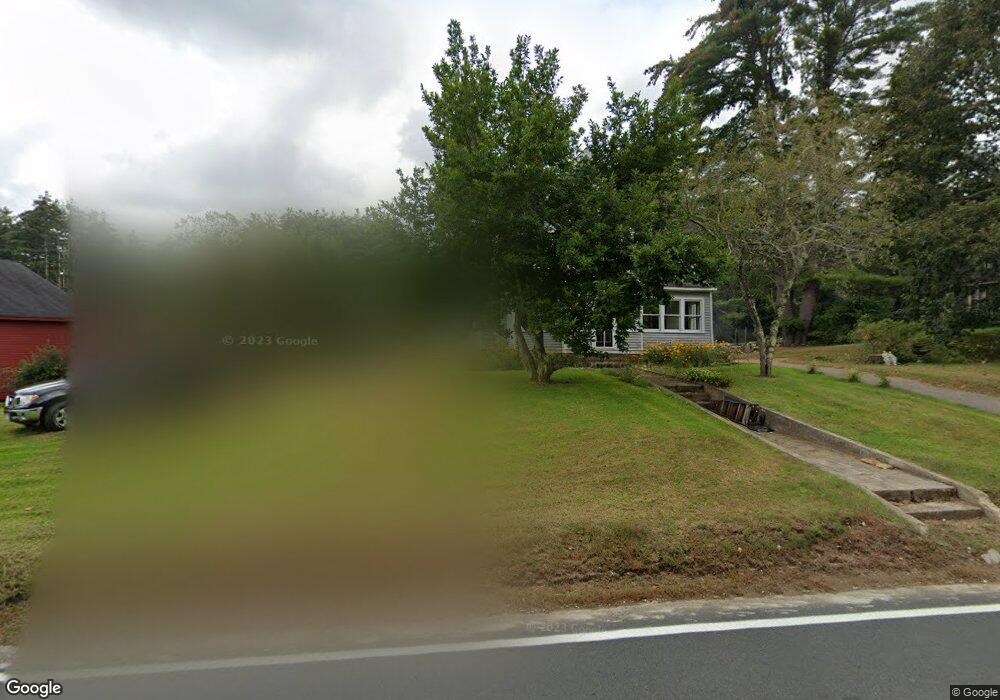
164 East St Stafford Springs, CT 06076
Estimated Value: $295,000 - $346,000
3
Beds
2
Baths
2,312
Sq Ft
$138/Sq Ft
Est. Value
About This Home
This home is located at 164 East St, Stafford Springs, CT 06076 and is currently estimated at $319,232, approximately $138 per square foot. 164 East St is a home located in Tolland County with nearby schools including Stafford Elementary School, Stafford Middle School, and Stafford High School.
Ownership History
Date
Name
Owned For
Owner Type
Purchase Details
Closed on
Mar 31, 2006
Sold by
Defiesta Reynaldo
Bought by
Zelonka Brian
Current Estimated Value
Home Financials for this Owner
Home Financials are based on the most recent Mortgage that was taken out on this home.
Original Mortgage
$126,966
Interest Rate
6.32%
Create a Home Valuation Report for This Property
The Home Valuation Report is an in-depth analysis detailing your home's value as well as a comparison with similar homes in the area
Home Values in the Area
Average Home Value in this Area
Purchase History
| Date | Buyer | Sale Price | Title Company |
|---|---|---|---|
| Zelonka Brian | $128,000 | -- |
Source: Public Records
Mortgage History
| Date | Status | Borrower | Loan Amount |
|---|---|---|---|
| Open | Zelonka Brian | $156,000 | |
| Closed | Zelonka Brian | $25,000 | |
| Closed | Zelonka Brian | $126,966 | |
| Closed | Zelonka Brian | $7,423 |
Source: Public Records
Tax History Compared to Growth
Tax History
| Year | Tax Paid | Tax Assessment Tax Assessment Total Assessment is a certain percentage of the fair market value that is determined by local assessors to be the total taxable value of land and additions on the property. | Land | Improvement |
|---|---|---|---|---|
| 2025 | $6,751 | $131,530 | $32,900 | $98,630 |
| 2024 | $5,076 | $131,530 | $32,900 | $98,630 |
| 2023 | $4,835 | $131,530 | $32,900 | $98,630 |
| 2022 | $4,706 | $131,530 | $32,900 | $98,630 |
| 2021 | $4,594 | $131,530 | $32,900 | $98,630 |
| 2020 | $4,250 | $121,660 | $36,400 | $85,260 |
| 2019 | $4,487 | $128,450 | $36,400 | $92,050 |
| 2018 | $4,401 | $128,450 | $36,400 | $92,050 |
| 2017 | $4,358 | $128,450 | $36,400 | $92,050 |
| 2016 | $7,019 | $128,450 | $36,400 | $92,050 |
| 2015 | $4,304 | $122,290 | $39,900 | $82,390 |
| 2014 | $4,039 | $122,290 | $39,900 | $82,390 |
Source: Public Records
Map
Nearby Homes