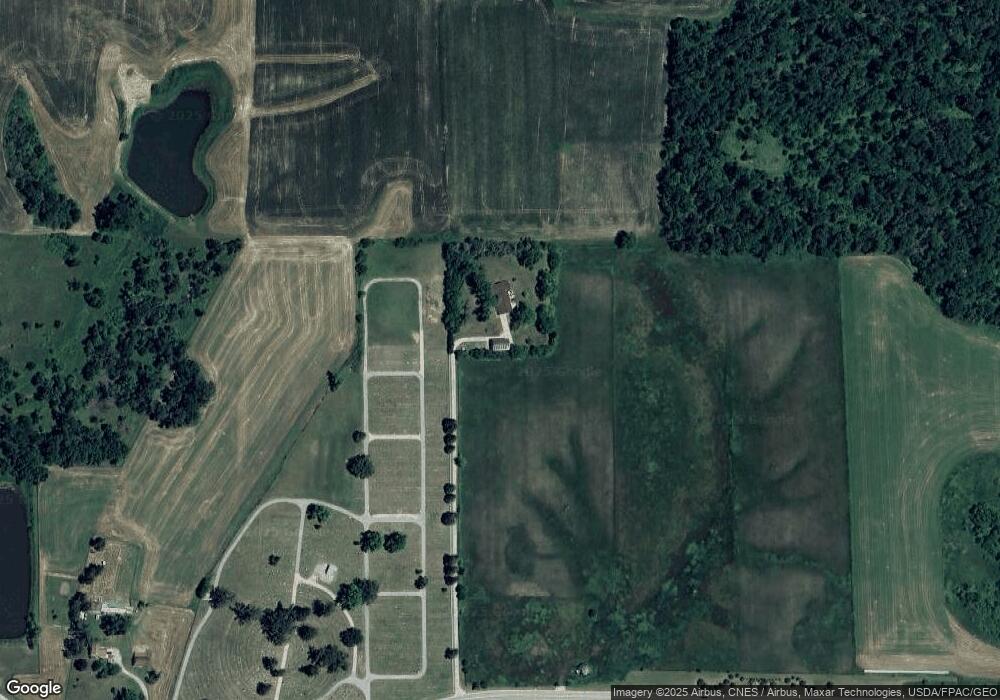
1640 13th St Belle Plaine, IA 52208
Estimated Value: $199,000 - $497,000
4
Beds
3
Baths
2,392
Sq Ft
$147/Sq Ft
Est. Value
About This Home
This home is located at 1640 13th St, Belle Plaine, IA 52208 and is currently estimated at $350,698, approximately $146 per square foot. 1640 13th St is a home located in Benton County with nearby schools including Longfellow Elementary School and Belle Plaine Junior/Senior High School.
Ownership History
Date
Name
Owned For
Owner Type
Purchase Details
Closed on
Aug 14, 2024
Sold by
Wittrock Martin J
Bought by
Janss Scott T and Janss Jane M
Current Estimated Value
Home Financials for this Owner
Home Financials are based on the most recent Mortgage that was taken out on this home.
Original Mortgage
$475,000
Outstanding Balance
$469,646
Interest Rate
6.89%
Mortgage Type
Credit Line Revolving
Estimated Equity
-$118,948
Create a Home Valuation Report for This Property
The Home Valuation Report is an in-depth analysis detailing your home's value as well as a comparison with similar homes in the area
Home Values in the Area
Average Home Value in this Area
Purchase History
| Date | Buyer | Sale Price | Title Company |
|---|---|---|---|
| Janss Scott T | $430,000 | -- |
Source: Public Records
Mortgage History
| Date | Status | Borrower | Loan Amount |
|---|---|---|---|
| Open | Janss Scott T | $475,000 |
Source: Public Records
Tax History Compared to Growth
Tax History
| Year | Tax Paid | Tax Assessment Tax Assessment Total Assessment is a certain percentage of the fair market value that is determined by local assessors to be the total taxable value of land and additions on the property. | Land | Improvement |
|---|---|---|---|---|
| 2025 | $5,504 | $392,000 | $72,800 | $319,200 |
| 2024 | $5,504 | $289,500 | $51,200 | $238,300 |
| 2023 | $5,040 | $289,500 | $51,200 | $238,300 |
| 2022 | $4,936 | $238,400 | $41,000 | $197,400 |
| 2021 | $4,936 | $238,400 | $41,000 | $197,400 |
| 2020 | $2,820 | $138,900 | $35,900 | $103,000 |
| 2019 | $3,338 | $138,900 | $35,900 | $103,000 |
| 2018 | $2,802 | $147,700 | $30,600 | $117,100 |
| 2017 | $2,808 | $147,700 | $30,600 | $117,100 |
| 2016 | $2,976 | $142,000 | $29,400 | $112,600 |
| 2015 | $2,976 | $142,000 | $29,400 | $112,600 |
| 2014 | $3,308 | $160,300 | $0 | $0 |
Source: Public Records
Map
Nearby Homes