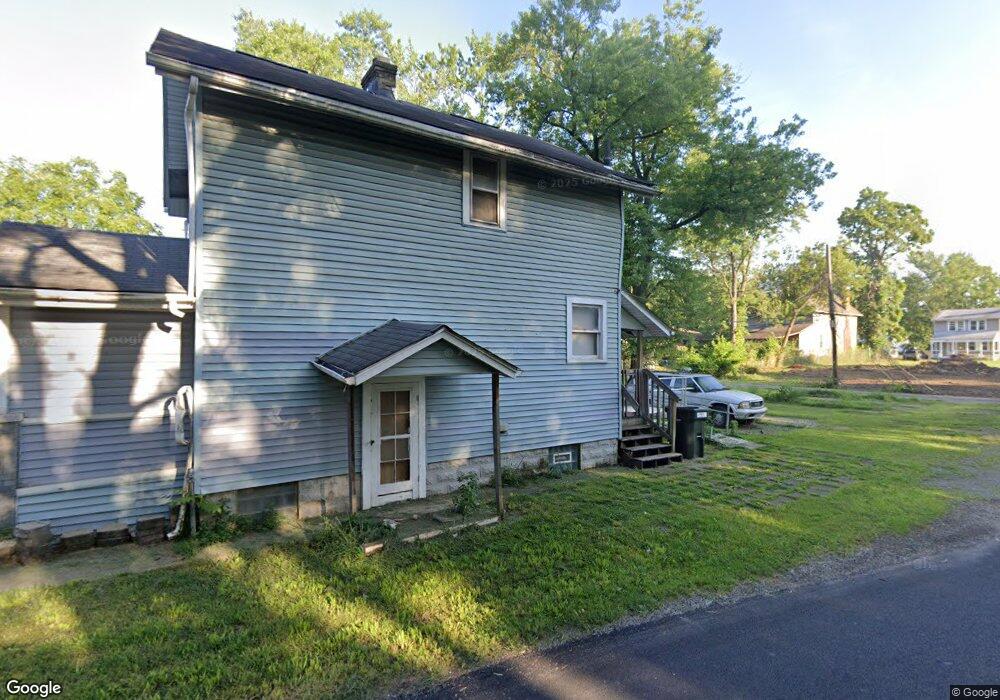
1640 Kenmore Rd Columbus, OH 43211
South Linden NeighborhoodEstimated Value: $114,758 - $125,000
2
Beds
1
Bath
1,006
Sq Ft
$119/Sq Ft
Est. Value
About This Home
This home is located at 1640 Kenmore Rd, Columbus, OH 43211 and is currently estimated at $119,690, approximately $118 per square foot. 1640 Kenmore Rd is a home located in Franklin County with nearby schools including Linden STEM Academy (K-6), Linden-Mckinley Stem School On Arcadia, and North Columbus Preparatory Academy.
Ownership History
Date
Name
Owned For
Owner Type
Purchase Details
Closed on
Dec 9, 2010
Sold by
Hollinger K and 1640 East Kenmore Road Residen
Bought by
Shaver Warren
Current Estimated Value
Purchase Details
Closed on
Oct 23, 2008
Sold by
Mohawk Diversified Llc
Bought by
Hollinger K and 1640 East Kenmore Road Residen
Purchase Details
Closed on
Aug 21, 2008
Sold by
Econohomes Llc
Bought by
Mohawk Diversified Llc
Purchase Details
Closed on
Nov 1, 2007
Sold by
Blue Spruce Entities Llc
Bought by
Econohomes Llc
Purchase Details
Closed on
Oct 31, 2007
Sold by
Gmac Mortgage Llc
Bought by
Blue Spruce Entities Llc
Purchase Details
Closed on
Jun 8, 2006
Sold by
Bolton Mattie L and Gmac Mortgage Corp
Bought by
Gmac Mortgage Llc
Purchase Details
Closed on
Mar 30, 1995
Sold by
Brown Janice S
Bought by
Botton Jake W Williams and Botton Mattie
Create a Home Valuation Report for This Property
The Home Valuation Report is an in-depth analysis detailing your home's value as well as a comparison with similar homes in the area
Home Values in the Area
Average Home Value in this Area
Purchase History
| Date | Buyer | Sale Price | Title Company |
|---|---|---|---|
| Shaver Warren | $52,300 | Attorney | |
| Hollinger K | $8,500 | Old School | |
| Mohawk Diversified Llc | $5,800 | Ecom Title Agency Llc | |
| Econohomes Llc | $3,500 | None Available | |
| Blue Spruce Entities Llc | $3,400 | None Available | |
| Gmac Mortgage Llc | $45,475 | None Available | |
| Botton Jake W Williams | $47,000 | -- |
Source: Public Records
Mortgage History
| Date | Status | Borrower | Loan Amount |
|---|---|---|---|
| Closed | Botton Jake W Williams | -- |
Source: Public Records
Tax History
| Year | Tax Paid | Tax Assessment Tax Assessment Total Assessment is a certain percentage of the fair market value that is determined by local assessors to be the total taxable value of land and additions on the property. | Land | Improvement |
|---|---|---|---|---|
| 2025 | $2,110 | $30,450 | $5,460 | $24,990 |
| 2024 | $2,110 | $30,450 | $5,460 | $24,990 |
| 2023 | $1,378 | $30,450 | $5,460 | $24,990 |
| 2022 | $1,956 | $11,410 | $2,380 | $9,030 |
| 2021 | $607 | $11,410 | $2,380 | $9,030 |
| 2020 | $608 | $11,410 | $2,380 | $9,030 |
| 2019 | $590 | $9,490 | $2,000 | $7,490 |
| 2018 | $590 | $9,490 | $2,000 | $7,490 |
| 2017 | $760 | $9,490 | $2,000 | $7,490 |
| 2016 | $703 | $8,750 | $2,380 | $6,370 |
| 2015 | $591 | $8,750 | $2,380 | $6,370 |
| 2014 | $543 | $8,750 | $2,380 | $6,370 |
| 2013 | $361 | $9,730 | $2,660 | $7,070 |
Source: Public Records
Map
Nearby Homes
- 1625 Kenmore Rd
- 1608 Kenmore Rd
- 1564-1566 E Blake Ave
- 1684 E Blake Ave
- 1554 E Maynard Ave
- 2305 Cleveland Ave
- 2126 Cleveland Ave
- 1481 Kohr Place
- 1457 Cordell Ave
- 1597 Republic Ave
- 0 E Maynard Ave
- 1430 Kenmore Rd
- 1810 E 26th Ave
- 1799 Harold Place
- 1864 E Hudson St
- 2195 Dresden St
- 1362 Clinton St
- 1366 Duxberry Ave
- 1555 Myrtle Ave
- 1805 E 26th Ave
- 1634 Kenmore Rd
- 1630 Kenmore Rd
- 1626 Kenmore Rd
- 1645 Kohr Place
- 1639 Kohr Place Unit 641
- 1622 Kenmore Rd
- 1635 Kohr Place
- 1651 Kohr Place
- 1635 Kenmore Rd
- 1616 Kenmore Rd
- 2193 Bancroft St
- 1629 Kenmore Rd
- 2187 Bancroft St
- 1627 Kohr Place Unit 629
- 2199 Bancroft St
- 2181 Bancroft St
- 2207 Bancroft St
- 1621 Kenmore Rd
- 1612 Kenmore Rd
- 2175 Bancroft St
Your Personal Tour Guide
Ask me questions while you tour the home.