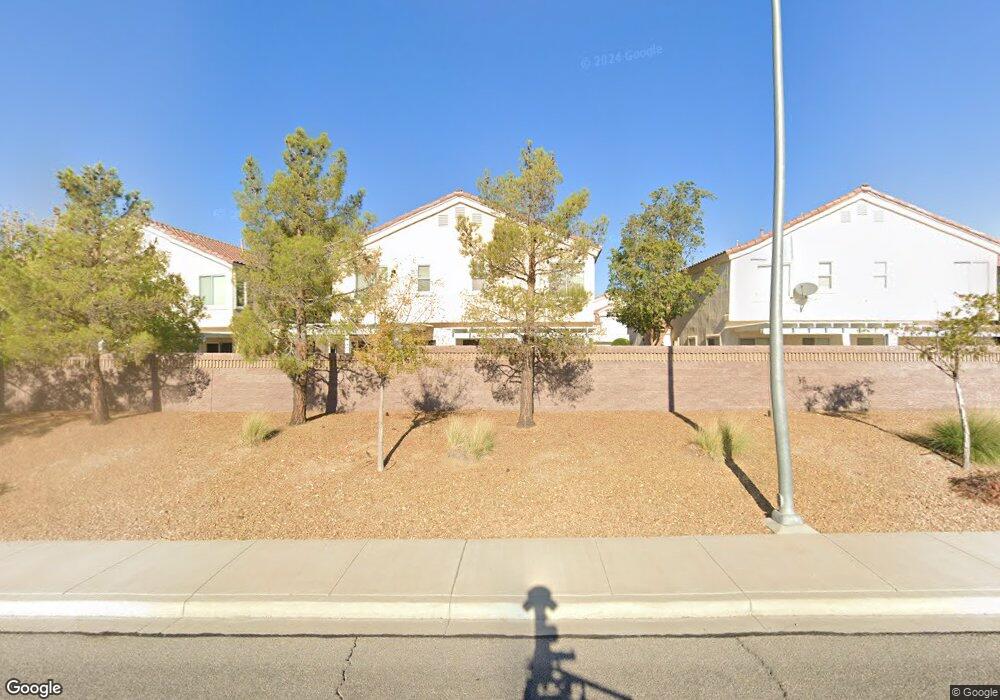
1640 Lefty Garcia Way Henderson, NV 89002
River Mountain NeighborhoodEstimated Value: $274,857 - $288,000
2
Beds
3
Baths
1,170
Sq Ft
$239/Sq Ft
Est. Value
About This Home
This home is located at 1640 Lefty Garcia Way, Henderson, NV 89002 and is currently estimated at $279,964, approximately $239 per square foot. 1640 Lefty Garcia Way is a home located in Clark County with nearby schools including J. Marlan Walker International School, Jack & Terry Mannion Middle School, and Basic Academy of International Studies.
Ownership History
Date
Name
Owned For
Owner Type
Purchase Details
Closed on
Aug 25, 2020
Sold by
Dabbour David and Dabbour Colleen
Bought by
Dabbour David and Dabbour Colleen
Current Estimated Value
Purchase Details
Closed on
Jun 8, 2015
Sold by
U S Bank Na
Bought by
Dabbour David and Dabbour Colleen
Purchase Details
Closed on
May 21, 2015
Sold by
Nationstar Mortgage Llc
Bought by
U S Bank Na
Purchase Details
Closed on
Aug 13, 2014
Sold by
Myrick Merle A and Myrick Helen O
Bought by
Nationstar Mortgage Llc and Champion Mortgage Co
Purchase Details
Closed on
Apr 14, 2003
Sold by
D R Horton Inc
Bought by
Myrick Merle A and Myrick Helen O
Home Financials for this Owner
Home Financials are based on the most recent Mortgage that was taken out on this home.
Original Mortgage
$104,750
Interest Rate
5.73%
Create a Home Valuation Report for This Property
The Home Valuation Report is an in-depth analysis detailing your home's value as well as a comparison with similar homes in the area
Home Values in the Area
Average Home Value in this Area
Purchase History
| Date | Buyer | Sale Price | Title Company |
|---|---|---|---|
| Dabbour David | -- | Accommodation | |
| Dabbour David | $103,000 | Noble Title | |
| U S Bank Na | $103,000 | Noble Title | |
| Nationstar Mortgage Llc | $191,123 | None Available | |
| Myrick Merle A | $131,025 | United Title Of Nevada |
Source: Public Records
Mortgage History
| Date | Status | Borrower | Loan Amount |
|---|---|---|---|
| Previous Owner | Myrick Merle A | $104,750 |
Source: Public Records
Tax History Compared to Growth
Tax History
| Year | Tax Paid | Tax Assessment Tax Assessment Total Assessment is a certain percentage of the fair market value that is determined by local assessors to be the total taxable value of land and additions on the property. | Land | Improvement |
|---|---|---|---|---|
| 2025 | $1,140 | $64,402 | $18,550 | $45,852 |
| 2024 | $1,056 | $64,402 | $18,550 | $45,852 |
| 2023 | $1,056 | $63,626 | $22,050 | $41,576 |
| 2022 | $978 | $58,391 | $18,900 | $39,491 |
| 2021 | $906 | $49,360 | $17,150 | $32,210 |
| 2020 | $838 | $49,398 | $15,750 | $33,648 |
| 2019 | $786 | $47,378 | $14,000 | $33,378 |
| 2018 | $750 | $41,698 | $9,800 | $31,898 |
| 2017 | $1,178 | $40,518 | $8,750 | $31,768 |
| 2016 | $703 | $37,766 | $7,700 | $30,066 |
| 2015 | $701 | $25,876 | $5,950 | $19,926 |
| 2014 | $679 | $22,622 | $4,550 | $18,072 |
Source: Public Records
Map
Nearby Homes
- 2566 Velez Valley Way
- 1603 Lefty Garcia Way
- 2560 Alias Smith Dr
- 2567 Land Rush Dr
- 1582 Wild Willey Way
- 1629 Lone Palm Ct
- 1070 Sheer Paradise Ln Unit 3
- 2509 April Breeze Ln
- 1557 Ward Frontier Ln
- 1092 Tuscan Sky Ln Unit 1
- 1554 Ward Frontier Ln
- 1081 Elation Ln Unit 2
- 1110 Tuscan Sky Ln Unit 2
- 1106 Luna Eclipse Ln Unit 3
- 1596 Rusty Ridge Ln
- 1093 Elation Ln Unit 2
- 1109 Tropical Star Ln Unit 1
- 1549 Broken Bell Ln
- 1085 Pleasure Ln Unit 3
- 1088 Paradise Coach Dr
- 1638 Lefty Garcia Way
- 1644 Lefty Garcia Way
- 1644 Lefty Garcia Way Unit 103
- 1642 Lefty Garcia Way
- 1646 Lefty Garcia Way
- 1634 Lefty Garcia Way
- 1648 Lefty Garcia Way
- 1648 Lefty Garcia Way Unit One
- 1636 Lefty Garcia Way
- 1632 Lefty Garcia Way
- 1650 Lefty Garcia Way Unit Plan 3
- 1650 Lefty Garcia Way
- 1654 Lefty Garcia Way Unit 1
- 1654 Lefty Garcia Way
- 1652 Lefty Garcia Way
- 1645 Lefty Garcia Way
- 1639 Lefty Garcia Way
- 1651 Lefty Garcia Way
- 1651 Lefty Garcia Way Unit 2
- 1651 Lefty Garcia Way Unit 101