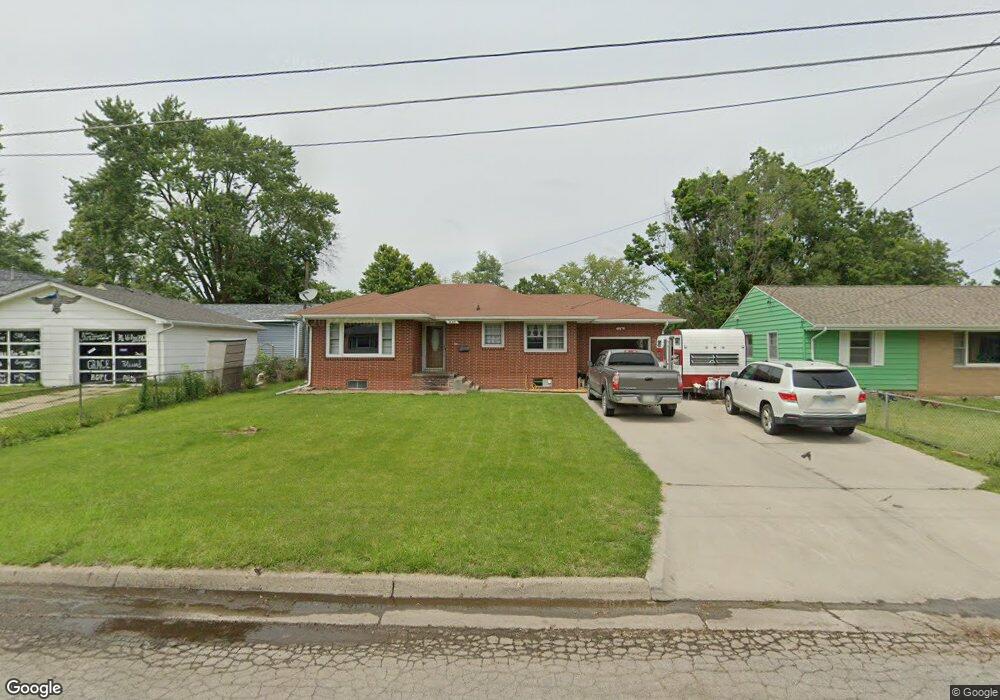
1640 Milton Ave Des Moines, IA 50316
Union Park NeighborhoodEstimated Value: $190,000 - $221,000
2
Beds
2
Baths
998
Sq Ft
$206/Sq Ft
Est. Value
About This Home
This home is located at 1640 Milton Ave, Des Moines, IA 50316 and is currently estimated at $206,021, approximately $206 per square foot. 1640 Milton Ave is a home located in Polk County with nearby schools including Cattell Elementary School, Goodrell Middle School, and North High School.
Ownership History
Date
Name
Owned For
Owner Type
Purchase Details
Closed on
Aug 19, 2015
Sold by
Beschen Thomas A and Beschen Karin
Bought by
Lo Pasee L
Current Estimated Value
Home Financials for this Owner
Home Financials are based on the most recent Mortgage that was taken out on this home.
Original Mortgage
$81,750
Outstanding Balance
$64,296
Interest Rate
4.03%
Mortgage Type
New Conventional
Estimated Equity
$141,725
Purchase Details
Closed on
Apr 29, 2015
Sold by
Jp Morgan Chase Bank Na
Bought by
Beschen Thomas A
Purchase Details
Closed on
Jan 6, 2015
Sold by
Simmons Jocelyn M and The Estate Of Anita Louise Bro
Bought by
Jpmorgan Chase Bank Na
Purchase Details
Closed on
Nov 8, 2006
Sold by
Kendall Vera Ellen
Bought by
Brown Anita L
Home Financials for this Owner
Home Financials are based on the most recent Mortgage that was taken out on this home.
Original Mortgage
$123,000
Interest Rate
6.38%
Mortgage Type
Purchase Money Mortgage
Create a Home Valuation Report for This Property
The Home Valuation Report is an in-depth analysis detailing your home's value as well as a comparison with similar homes in the area
Home Values in the Area
Average Home Value in this Area
Purchase History
| Date | Buyer | Sale Price | Title Company |
|---|---|---|---|
| Lo Pasee L | $109,000 | Attorney | |
| Beschen Thomas A | $79,800 | None Available | |
| Jpmorgan Chase Bank Na | $118,170 | None Available | |
| Brown Anita L | $122,500 | None Available |
Source: Public Records
Mortgage History
| Date | Status | Borrower | Loan Amount |
|---|---|---|---|
| Open | Lo Pasee L | $81,750 | |
| Previous Owner | Brown Anita L | $123,000 |
Source: Public Records
Tax History Compared to Growth
Tax History
| Year | Tax Paid | Tax Assessment Tax Assessment Total Assessment is a certain percentage of the fair market value that is determined by local assessors to be the total taxable value of land and additions on the property. | Land | Improvement |
|---|---|---|---|---|
| 2024 | $3,778 | $192,000 | $26,100 | $165,900 |
| 2023 | $3,638 | $192,000 | $26,100 | $165,900 |
| 2022 | $3,612 | $154,400 | $21,800 | $132,600 |
| 2021 | $3,368 | $154,400 | $21,800 | $132,600 |
| 2020 | $3,500 | $135,000 | $19,000 | $116,000 |
| 2019 | $3,466 | $135,000 | $19,000 | $116,000 |
| 2018 | $3,432 | $129,000 | $17,700 | $111,300 |
| 2017 | $3,194 | $129,000 | $17,700 | $111,300 |
| 2016 | $3,112 | $118,100 | $16,000 | $102,100 |
| 2015 | $3,112 | $118,100 | $16,000 | $102,100 |
| 2014 | $3,356 | $120,100 | $15,900 | $104,200 |
Source: Public Records
Map
Nearby Homes
- 2517 Sampson St
- 2529 Glenbrook Dr
- 1617 Guthrie Ave
- 2706 E 16th St
- 1514 Guthrie Ave
- 1424 Milton Ave
- 1432 Royer St
- 1602 Wilson Ave
- 1530 Mattern Ave
- 1443 Wilson Ave
- 1332 E Sheridan Ave
- 1434 Mattern Ave
- 1422 Hull Ave
- 2336 E 13th St
- 1526 E Jefferson Ave
- 1427 Mattern Ave
- 1400 Mattern Ave
- 2018 York St
- 1424 Richmond Ave
- 1520 E Tiffin Ave
- 1646 Milton Ave
- 2407 E 16th St
- 2403 E 16th St
- 2411 E 16th St
- 1654 Milton Ave
- 2415 E 16th St
- 1645 Arthur Ave
- 1651 Arthur Ave
- 2419 E 16th St
- 1645 Milton Ave
- 1660 Milton Ave
- 2423 E 16th St
- 2406 Glenbrook Dr
- 1639 Milton Ave
- 1635 Milton Ave
- 1663 Arthur Ave
- 2322 Glenbrook Dr
- 2412 Glenbrook Dr
- 1629 Milton Ave
- 2404 E 16th St