
1640 Wainwright Dr Reston, VA 20190
Lake Anne NeighborhoodEstimated payment $5,442/month
Total Views
96,715
4
Beds
3.5
Baths
2,550
Sq Ft
$347
Price per Sq Ft
Highlights
- Scenic Views
- Open Floorplan
- Recreation Room
- Langston Hughes Middle School Rated A-
- Midcentury Modern Architecture
- 2-minute walk to Wainwright Field
About This Home
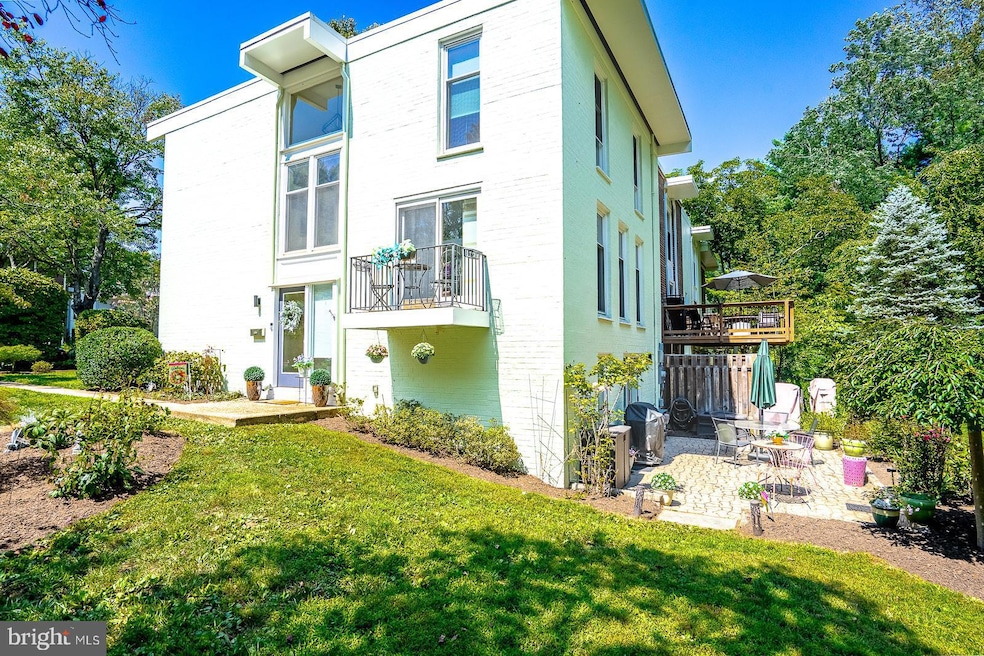
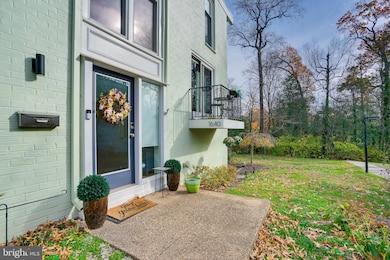
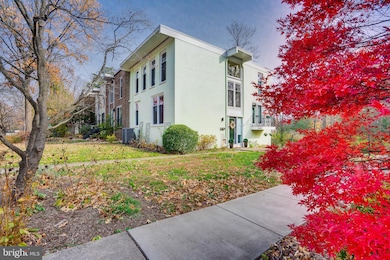
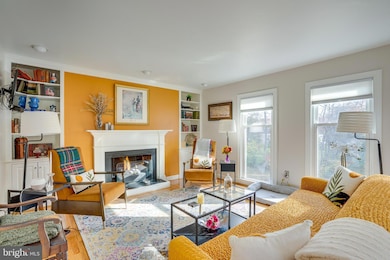
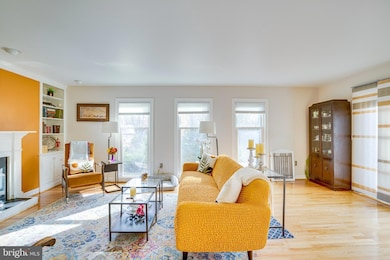
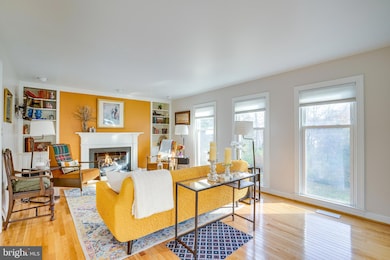
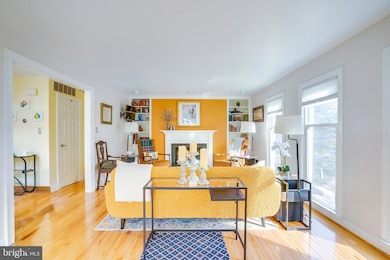
Stunning End-Unit Townhouse Designed by Chloethiel Woodward Smith, FAIA in Reston’s Coleson Cluster This exceptional end-unit townhouse—crafted by renowned mid-century architect Chloethiel Woodward Smith, FAIA—beautifully balances iconic design with a full suite of modern, high-end renovations. Nestled in Reston’s sought-after Coleson Cluster, this home is a rare opportunity to own an architectural gem just moments from both Lake Anne Village Center and Reston Town Center. Step inside to discover a completely refreshed interior with new flooring throughout and an abundance of natural light that accentuates the clean lines and timeless character of Smith’s mid-century vision. The home has been thoughtfully updated with a new HVAC system, dual-fuel heat, replaced windows, and a new, upgraded electrical panel complete with a whole-house surge protector—ensuring comfort and peace of mind for years to come. Design-forward upgrades elevate every room, including two custom designer gas fireplaces that serve as striking focal points. In the bathrooms, strategically placed sun tunnels bathe the primary and secondary baths in soft, natural light—an elegant touch that honors the home's modernist roots. Every enhancement has been carefully executed to harmonize with the property’s architectural heritage, resulting in a home that feels both fresh and authentically mid-century. With its unbeatable walkable location, sophisticated renovations, and distinctive pedigree, this townhouse is truly one-of-a-kind. A rare architectural treasure—modernized, thoughtfully improved, and ideally located. Welcome home.
Listing Agent
(703) 783-7485 licensingdmv@compass.com Compass Brokerage Phone: 7037837485 Listed on: 11/22/2025
Townhouse Details
Home Type
- Townhome
Est. Annual Taxes
- $8,171
Year Built
- Built in 1966 | Remodeled in 2024
Lot Details
- 3,041 Sq Ft Lot
- Open Space
- Backs to Trees or Woods
HOA Fees
- $202 Monthly HOA Fees
Property Views
- Scenic Vista
- Woods
- Garden
Home Design
- Midcentury Modern Architecture
- Concrete Perimeter Foundation
Interior Spaces
- Property has 3 Levels
- Open Floorplan
- 2 Fireplaces
- Fireplace With Glass Doors
- Window Treatments
- Living Room
- Combination Kitchen and Dining Room
- Recreation Room
- Natural lighting in basement
Kitchen
- Gas Oven or Range
- Range Hood
- Microwave
- Dishwasher
- Upgraded Countertops
- Disposal
Bedrooms and Bathrooms
- Walk-in Shower
- Solar Tube
Laundry
- Dryer
- Washer
Parking
- 1 Parking Space
- 1 Detached Carport Space
- Surface Parking
- 1 Assigned Parking Space
- Unassigned Parking
Outdoor Features
- Patio
Schools
- Lake Anne Elementary School
- Hughes Middle School
- South Lakes High School
Utilities
- Central Air
- Heating System Uses Natural Gas
- Back Up Gas Heat Pump System
- Electric Water Heater
Listing and Financial Details
- Tax Lot 40
- Assessor Parcel Number 0172 13150040
Community Details
Overview
- $848 Recreation Fee
- Coleson Cluster HOA
- Built by Chloethiel Woodard Smith, FAIA
- Reston Subdivision
Recreation
- Community Pool
Pet Policy
- Pets Allowed
Map
Create a Home Valuation Report for This Property
The Home Valuation Report is an in-depth analysis detailing your home's value as well as a comparison with similar homes in the area
Home Values in the Area
Average Home Value in this Area
Tax History
| Year | Tax Paid | Tax Assessment Tax Assessment Total Assessment is a certain percentage of the fair market value that is determined by local assessors to be the total taxable value of land and additions on the property. | Land | Improvement |
|---|---|---|---|---|
| 2025 | -- | $679,240 | $135,000 | $544,240 |
| 2024 | -- | $633,420 | $125,000 | $508,420 |
| 2023 | $6,430 | $587,200 | $125,000 | $462,200 |
| 2022 | $7,093 | $620,300 | $125,000 | $495,300 |
| 2021 | $0 | $527,690 | $115,000 | $412,690 |
| 2020 | $6,128 | $498,040 | $105,000 | $393,040 |
| 2019 | $6,034 | $490,330 | $105,000 | $385,330 |
| 2018 | $5,639 | $490,330 | $105,000 | $385,330 |
| 2017 | $5,788 | $479,110 | $105,000 | $374,110 |
| 2016 | $5,602 | $464,740 | $105,000 | $359,740 |
| 2015 | $5,387 | $463,180 | $105,000 | $358,180 |
| 2014 | $5,375 | $463,180 | $105,000 | $358,180 |
Source: Public Records
Property History
| Date | Event | Price | List to Sale | Price per Sq Ft |
|---|---|---|---|---|
| 11/22/2025 11/22/25 | For Sale | $885,000 | -- | $347 / Sq Ft |
Source: Bright MLS
Purchase History
| Date | Type | Sale Price | Title Company |
|---|---|---|---|
| Interfamily Deed Transfer | -- | None Available | |
| Warranty Deed | $495,000 | -- |
Source: Public Records
Mortgage History
| Date | Status | Loan Amount | Loan Type |
|---|---|---|---|
| Open | $486,034 | FHA |
Source: Public Records
About the Listing Agent
As a business professional Eve brings that same caring into each real estate transaction she handles. Making sure that everything that needs to happen happens with a minimum amount of hassle for her buyers and sellers. Eve has chosen to work exclusively in Reston because she knows that the greatest value she adds is in knowing and believing in Reston as a great place to live. - See more at: http://allrestonrealestate.com/about-eve/#sthash.JR5lN4S8.dpuf
Eve's Other Listings
Source: Bright MLS
MLS Number: VAFX2279574
APN: 0172-13150040
Disclaimer: Certain information contained herein is derived from information provided by parties other than Homes.com. All information provided is deemed reliable, but is not guaranteed to be accurate and should be independently verified.
![]() The data relating to real estate for sale on this website appears in part through the BRIGHT Internet Data Exchange program, a voluntary cooperative exchange of property listing data between licensed real estate brokerage firms, and is provided by BRIGHT through a licensing agreement.
The data relating to real estate for sale on this website appears in part through the BRIGHT Internet Data Exchange program, a voluntary cooperative exchange of property listing data between licensed real estate brokerage firms, and is provided by BRIGHT through a licensing agreement.
Listing information is from various brokers who participate in the Bright MLS IDX program and not all listings may be visible on the site.
The property information being provided on or through the website is for the personal, non-commercial use of consumers and such information may not be used for any purpose other than to identify prospective properties consumers may be interested in purchasing.
Some properties which appear for sale on the website may no longer be available because they are for instance, under contract, sold or are no longer being offered for sale.
Property information displayed is deemed reliable but is not guaranteed.
Copyright 2026 Bright MLS, Inc.
Nearby Homes
- 1644 Wainwright Dr
- 11663 Vantage Hill Rd
- 1781 Wainwright Dr
- 1661 Bachan Ct
- 1723 Ascot Way Unit A
- 1727 Ascot Way Unit 1727C
- 11503 Waterhaven Ct
- 11703 Olde English Dr Unit B
- 11500 Fairway Dr Unit 507
- 11256 Faraday Park Dr
- 1735 Ivy Oak Square Unit 7
- 1624 Fellowship Square
- 11400 Washington Plaza W Unit 1303
- 11400 Washington Plaza W Unit 103
- 1610 Fellowship Square
- 11776 Stratford House Place Unit 507
- 11776 Stratford House Place Unit 901
- 11776 Stratford House Place Unit 601
- 1851 Stratford Park Place Unit 109
- 1851 Stratford Park Place Unit 212
- 11659 North Shore Dr
- 11625 Vantage Hill Rd Unit 22B
- 11657 Chesterfield Ct
- 1715 Ascot Way Unit C
- 1785 Jonathan Way Unit 1785-C
- 11703 Olde English Dr
- 11500 Fairway Dr Unit 402
- 11637 Charter Oak Ct
- 1800 Jonathan Way
- 1815A Sycamore Valley Dr
- 11850 Freedom Dr Unit FL12-ID847
- 11850 Freedom Dr Unit FL19-ID849
- 11850 Freedom Dr Unit FL16-ID845
- 11850 Freedom Dr
- 11911 Freedom Dr Unit ID1043305P
- 11911 Freedom Dr Unit ID1039952P
- 11911 Freedom Dr Unit ID1042373P
- 11911 Freedom Dr Unit ID1043417P
- 1704 Quietree Dr
- 12016 Waterside View Dr
Your Personal Tour Guide
Ask me questions while you tour the home.