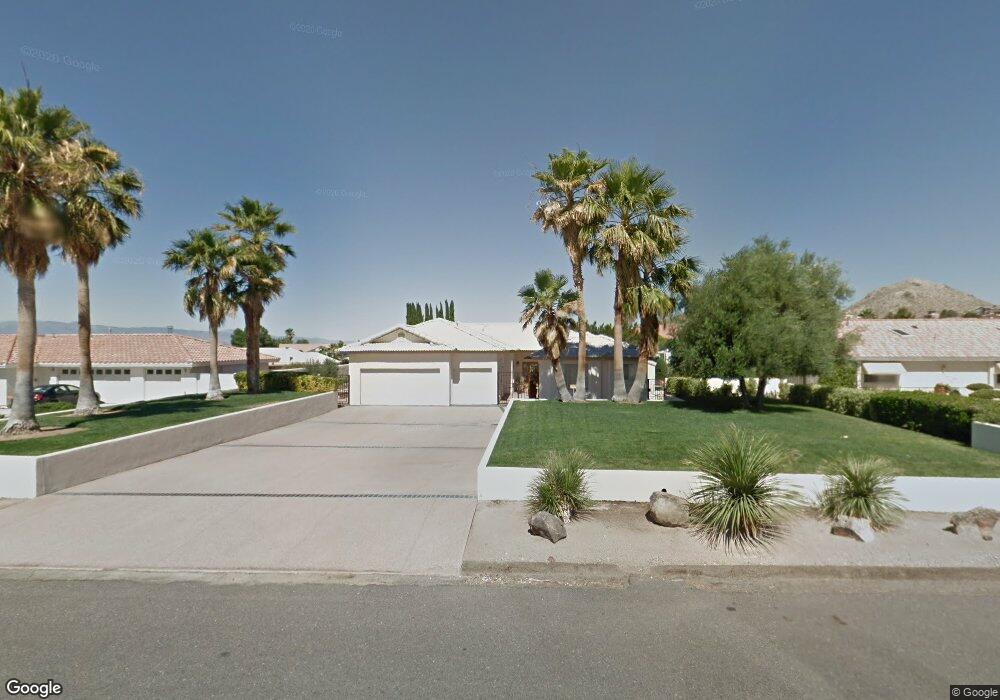
16402 Menahka Rd Apple Valley, CA 92307
High Desert NeighborhoodEstimated Value: $502,473 - $681,000
3
Beds
3
Baths
2,349
Sq Ft
$251/Sq Ft
Est. Value
About This Home
This home is located at 16402 Menahka Rd, Apple Valley, CA 92307 and is currently estimated at $590,118, approximately $251 per square foot. 16402 Menahka Rd is a home located in San Bernardino County with nearby schools including Desert Knolls Elementary School, Granite Hills High School, and Academy for Academic Excellence.
Ownership History
Date
Name
Owned For
Owner Type
Purchase Details
Closed on
Jun 6, 2013
Sold by
Morgan Barbara C Schultess and Schulthess Barbara C
Bought by
Roberts Mandle C and Roberts Sandra J
Current Estimated Value
Home Financials for this Owner
Home Financials are based on the most recent Mortgage that was taken out on this home.
Original Mortgage
$145,000
Outstanding Balance
$103,099
Interest Rate
3.48%
Mortgage Type
New Conventional
Estimated Equity
$487,019
Purchase Details
Closed on
Jan 23, 2003
Sold by
Lemoine Geraldine
Bought by
Schulthess Rick C and Schulthess Barbara C
Home Financials for this Owner
Home Financials are based on the most recent Mortgage that was taken out on this home.
Original Mortgage
$232,000
Interest Rate
5.37%
Mortgage Type
Purchase Money Mortgage
Purchase Details
Closed on
Jan 17, 1997
Sold by
Russo Philip L and Russo Alice
Bought by
Lemoine Geraldine
Create a Home Valuation Report for This Property
The Home Valuation Report is an in-depth analysis detailing your home's value as well as a comparison with similar homes in the area
Home Values in the Area
Average Home Value in this Area
Purchase History
| Date | Buyer | Sale Price | Title Company |
|---|---|---|---|
| Roberts Mandle C | $295,000 | Chicago Title Company | |
| Schulthess Rick C | $290,000 | Fidelity National Title | |
| Lemoine Geraldine | -- | Fidelity National Title Ins |
Source: Public Records
Mortgage History
| Date | Status | Borrower | Loan Amount |
|---|---|---|---|
| Open | Roberts Mandle C | $145,000 | |
| Previous Owner | Schulthess Rick C | $232,000 |
Source: Public Records
Tax History Compared to Growth
Tax History
| Year | Tax Paid | Tax Assessment Tax Assessment Total Assessment is a certain percentage of the fair market value that is determined by local assessors to be the total taxable value of land and additions on the property. | Land | Improvement |
|---|---|---|---|---|
| 2025 | $4,006 | $363,271 | $43,100 | $320,171 |
| 2024 | $4,006 | $356,148 | $42,255 | $313,893 |
| 2023 | $3,970 | $349,164 | $41,426 | $307,738 |
| 2022 | $3,908 | $342,318 | $40,614 | $301,704 |
| 2021 | $3,818 | $335,606 | $39,818 | $295,788 |
| 2020 | $3,771 | $332,165 | $39,410 | $292,755 |
| 2019 | $3,700 | $325,652 | $38,637 | $287,015 |
| 2018 | $3,607 | $319,266 | $37,879 | $281,387 |
| 2017 | $3,557 | $313,006 | $37,136 | $275,870 |
| 2016 | $3,437 | $306,869 | $36,408 | $270,461 |
| 2015 | $3,385 | $302,259 | $35,861 | $266,398 |
| 2014 | $3,339 | $296,339 | $35,159 | $261,180 |
Source: Public Records
Map
Nearby Homes
- 123 Menahka Rd Unit 638
- 16501 Menahka Rd
- 0 Kamana Rd
- 0 Menahka Ct
- 16385 Kamana Ct
- 16465 Koda Rd
- 0 Kamana Ct Unit HD25079746
- 16601 Kasota Rd
- 18668 Kamana Rd
- 16620 Iwa Rd
- 0 Muni Rd Unit HD24234033
- 16560 Koda Rd
- 16457 Viho Rd
- 0 Munsee Rd
- 18765 Munsee Rd
- 18830 Munsee Rd
- 0 Viho Rd
- 47339211 Kokanee Rd
- 0 Tao Rd Unit CV23214930
- 0 Kasota Rd Unit HD25183847
- 16418 Menahka Rd
- 16388 Menahka Rd
- 16397 Kasota Rd
- 0 Menahka Rd
- 16372 Menahka Rd
- 16434 Menahka Rd
- 18419 Kamana Rd
- 16397 Menahka Rd
- 16415 Menahka Rd
- 16411 Kasota Rd
- 18437 Kamana Rd
- 16429 Menahka Rd
- 16365 Kasota Rd
- 16352 Menahka Rd
- 16367 Menahka Rd
- 16462 Menahka Rd
- 18397 Kamana Rd
- 16443 Menahka Rd
- 16499 Kamana Rd
- 16353 Menahka Rd