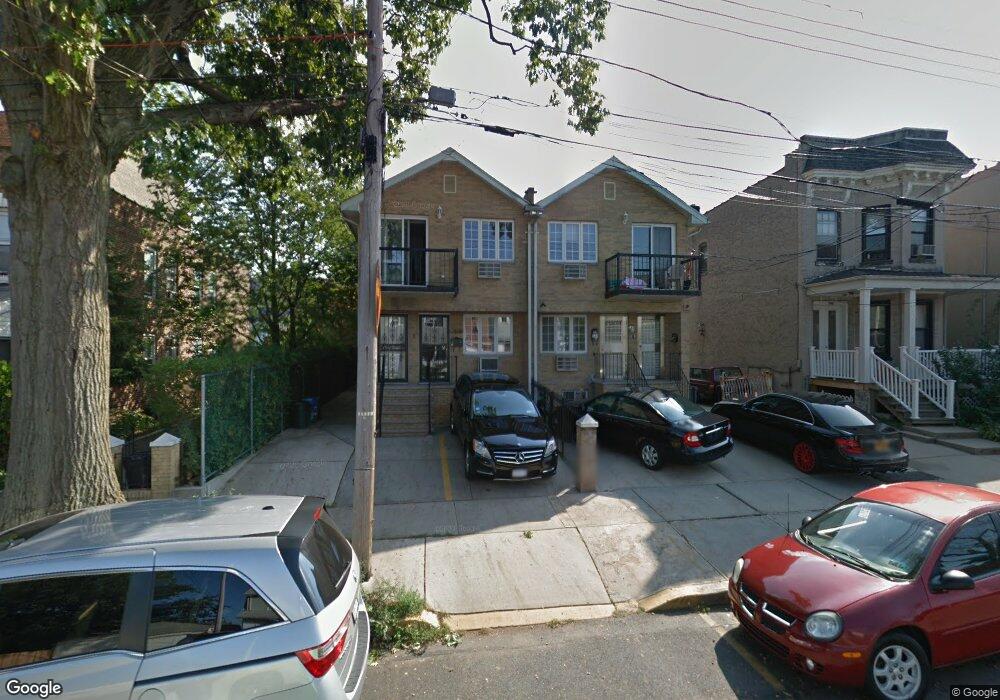
16406 43rd Ave Flushing, NY 11358
East Flushing NeighborhoodEstimated Value: $1,206,000 - $1,711,000
Studio
--
Bath
2,142
Sq Ft
$688/Sq Ft
Est. Value
About This Home
This home is located at 16406 43rd Ave, Flushing, NY 11358 and is currently estimated at $1,474,261, approximately $688 per square foot. 16406 43rd Ave is a home located in Queens County with nearby schools including P.S. 107 Thomas A Dooley, I.S. 25 Adrien Block, and Francis Lewis High School.
Ownership History
Date
Name
Owned For
Owner Type
Purchase Details
Closed on
Dec 18, 2025
Sold by
Xu Xiu Liang and Xu Yan
Bought by
Xingru Xu As Trustee and Xu Family Trust 2025
Current Estimated Value
Purchase Details
Closed on
Jun 3, 2008
Sold by
Liu Yun Li
Bought by
Xu Xiu Liang and Xu Yan
Home Financials for this Owner
Home Financials are based on the most recent Mortgage that was taken out on this home.
Original Mortgage
$400,000
Interest Rate
6.1%
Mortgage Type
Purchase Money Mortgage
Purchase Details
Closed on
Aug 13, 2004
Sold by
Han Kinam
Bought by
Liu Yun Li
Home Financials for this Owner
Home Financials are based on the most recent Mortgage that was taken out on this home.
Original Mortgage
$315,000
Interest Rate
6.02%
Mortgage Type
Purchase Money Mortgage
Purchase Details
Closed on
Aug 11, 2004
Sold by
Han Kinam
Bought by
Lindo Dilia
Home Financials for this Owner
Home Financials are based on the most recent Mortgage that was taken out on this home.
Original Mortgage
$315,000
Interest Rate
6.02%
Mortgage Type
Purchase Money Mortgage
Purchase Details
Closed on
Jan 21, 2000
Sold by
Higashi Shohaku
Bought by
Han Kinam
Create a Home Valuation Report for This Property
The Home Valuation Report is an in-depth analysis detailing your home's value as well as a comparison with similar homes in the area
Home Values in the Area
Average Home Value in this Area
Purchase History
| Date | Buyer | Sale Price | Title Company |
|---|---|---|---|
| Xingru Xu As Trustee | -- | -- | |
| Xu Xiu Liang | $755,000 | -- | |
| Xu Xiu Liang | $755,000 | -- | |
| Xu Xiu Liang | $755,000 | -- | |
| Liu Yun Li | $496,860 | -- | |
| Liu Yun Li | $496,860 | -- | |
| Liu Yun Li | $496,860 | -- | |
| Lindo Dilia | $550,000 | -- | |
| Lindo Dilia | $550,000 | -- | |
| Lindo Dilia | $550,000 | -- | |
| Lindo Dilia | $550,000 | -- | |
| Han Kinam | $200,000 | Venture Title | |
| Han Kinam | $200,000 | Venture Title |
Source: Public Records
Mortgage History
| Date | Status | Borrower | Loan Amount |
|---|---|---|---|
| Previous Owner | Xu Xiu Liang | $400,000 | |
| Previous Owner | Liu Yun Li | $315,000 | |
| Previous Owner | Lindo Dilia | $400,000 |
Source: Public Records
Tax History
| Year | Tax Paid | Tax Assessment Tax Assessment Total Assessment is a certain percentage of the fair market value that is determined by local assessors to be the total taxable value of land and additions on the property. | Land | Improvement |
|---|---|---|---|---|
| 2025 | $10,350 | $56,105 | $16,840 | $39,265 |
| 2024 | $10,362 | $52,931 | $18,008 | $34,923 |
| 2023 | $9,748 | $49,936 | $16,758 | $33,178 |
| 2022 | $6,838 | $74,160 | $23,700 | $50,460 |
| 2021 | $9,619 | $79,320 | $23,700 | $55,620 |
| 2020 | $9,600 | $80,160 | $23,700 | $56,460 |
| 2019 | $8,934 | $84,000 | $23,700 | $60,300 |
| 2018 | $8,185 | $41,613 | $13,743 | $27,870 |
| 2017 | $7,703 | $39,259 | $14,968 | $24,291 |
| 2016 | $7,538 | $39,259 | $14,968 | $24,291 |
| 2015 | $4,005 | $38,962 | $19,283 | $19,679 |
| 2014 | $4,005 | $36,758 | $19,631 | $17,127 |
Source: Public Records
Map
Nearby Homes
- 43-33 163rd St
- 43-58 163rd St
- 43-27 162nd St
- 163-02 45th Ave
- 4328 168th St
- 45-18 166th St
- 167-22 Northern Blvd
- 42-16 162nd St
- 4344 161st St
- 4363 160th St
- 4018 165th St
- 45-25 168th St
- 4012 166th St
- 45-74 164th St
- 16003 Sanford Ave
- 16001 Sanford Ave
- 45-57 160th St
- 36-40 167th St
- 42-28 159th St
- 4564 170th St
- 16404 43rd Ave
- 16408 43rd Ave
- 164-06 43rd Ave
- 16402 43rd Ave
- 16412 43rd Ave
- 164-08 43rd Ave
- 4315 164th St
- 43-15 164th St
- 43-19 164 St
- 43-19 164 St Unit 1Fl
- 43-19 164 St Unit 2FL
- 4317 164th St
- 4312 165th St
- 0 43rd Ave Unit 2999246
- 16418 43rd Ave
- 4319 164th St
- 43-19 164th St
- 43-19 164th St Unit 1FL+BM
- 43-19 164th St Unit 1FL
Your Personal Tour Guide
Ask me questions while you tour the home.