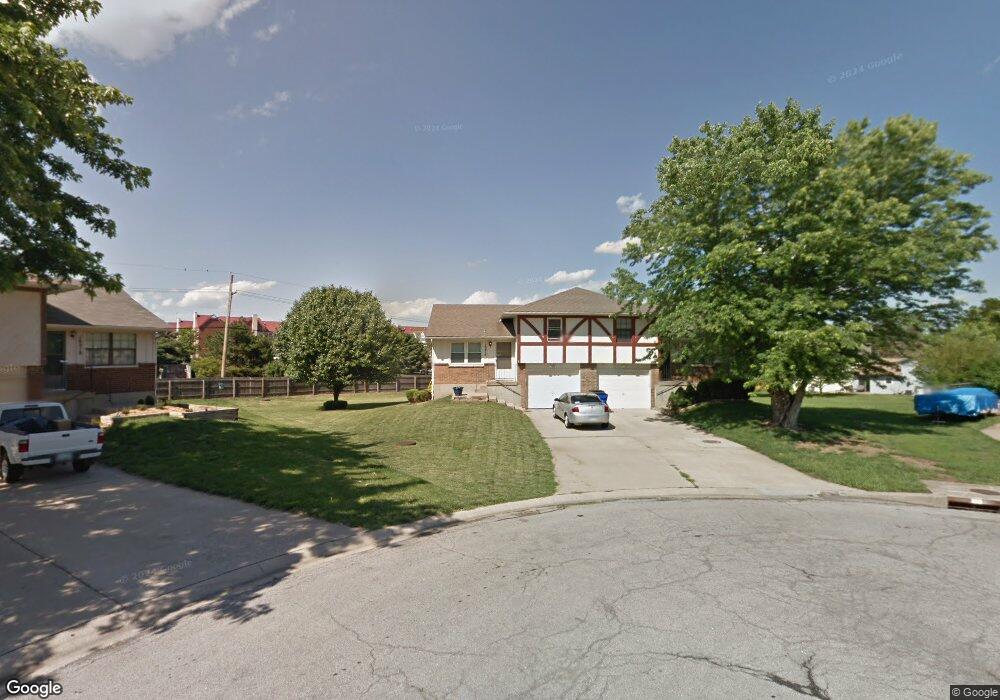
16412 W 123rd St Olathe, KS 66062
Estimated Value: $229,000 - $257,160
2
Beds
1
Bath
864
Sq Ft
$278/Sq Ft
Est. Value
About This Home
This home is located at 16412 W 123rd St, Olathe, KS 66062 and is currently estimated at $240,040, approximately $277 per square foot. 16412 W 123rd St is a home located in Johnson County with nearby schools including Countryside Elementary School, Pioneer Trail Middle School, and Olathe East Sr High School.
Ownership History
Date
Name
Owned For
Owner Type
Purchase Details
Closed on
Oct 25, 2021
Sold by
Santos Cleiton R
Bought by
Santos Monica R and Amaral Monica Moreira
Current Estimated Value
Home Financials for this Owner
Home Financials are based on the most recent Mortgage that was taken out on this home.
Original Mortgage
$123,500
Outstanding Balance
$112,992
Interest Rate
2.88%
Mortgage Type
New Conventional
Estimated Equity
$127,048
Purchase Details
Closed on
Oct 14, 2019
Sold by
Carlis Tyrone D and Carlis Erica D
Bought by
Santos Cleiton R and Amaral Monica M
Home Financials for this Owner
Home Financials are based on the most recent Mortgage that was taken out on this home.
Original Mortgage
$87,500
Interest Rate
9%
Mortgage Type
New Conventional
Purchase Details
Closed on
May 17, 2002
Sold by
Melton Kristy L and Melton Rich
Bought by
Weber Eric D
Home Financials for this Owner
Home Financials are based on the most recent Mortgage that was taken out on this home.
Original Mortgage
$96,544
Interest Rate
6.12%
Create a Home Valuation Report for This Property
The Home Valuation Report is an in-depth analysis detailing your home's value as well as a comparison with similar homes in the area
Home Values in the Area
Average Home Value in this Area
Purchase History
| Date | Buyer | Sale Price | Title Company |
|---|---|---|---|
| Santos Monica R | -- | None Available | |
| Santos Cleiton R | -- | Alpha Title Guaranty Inc | |
| Weber Eric D | -- | Columbian National Title Ins |
Source: Public Records
Mortgage History
| Date | Status | Borrower | Loan Amount |
|---|---|---|---|
| Open | Santos Monica R | $123,500 | |
| Closed | Santos Cleiton R | $87,500 | |
| Previous Owner | Weber Eric D | $96,544 |
Source: Public Records
Tax History Compared to Growth
Tax History
| Year | Tax Paid | Tax Assessment Tax Assessment Total Assessment is a certain percentage of the fair market value that is determined by local assessors to be the total taxable value of land and additions on the property. | Land | Improvement |
|---|---|---|---|---|
| 2024 | $2,719 | $24,829 | $4,498 | $20,331 |
| 2023 | $2,670 | $23,644 | $3,909 | $19,735 |
| 2022 | $2,328 | $20,114 | $3,909 | $16,205 |
| 2021 | $2,181 | $17,814 | $3,556 | $14,258 |
| 2020 | $2,074 | $16,802 | $3,089 | $13,713 |
| 2019 | $2,142 | $17,227 | $3,089 | $14,138 |
| 2018 | $1,905 | $15,249 | $2,806 | $12,443 |
| 2017 | $1,889 | $14,962 | $2,437 | $12,525 |
| 2016 | $1,770 | $14,398 | $2,437 | $11,961 |
| 2015 | $1,683 | $13,708 | $2,437 | $11,271 |
| 2013 | -- | $12,501 | $2,351 | $10,150 |
Source: Public Records
Map
Nearby Homes
- 16406 W 123rd St
- 16319 W 124th St
- 16604 W 125th St
- 16019 W 124th Terrace
- 16304 W 125th Terrace
- 16128 W 125th Place
- 12400 S Seminole Dr
- 15619 W 125th St
- 15706 W 126th St
- 15611 W 125th St
- 15622 W 126th St
- 17366 S Raintree Dr Unit Bldg J Unit 40
- 17370 S Raintree Dr Unit BLDG J Unit 39
- 17378 S Raintree Dr Unit Bldg J Unit 37
- 15710 W 128th St
- 16204 S Twilight Ln
- 16019 S Twilight Ln
- 15982 S Twilight Ln
- 15998 S Twilight Ln
- 16046 S Twilight Ln
- 16414 W 123rd St
- 16418 W 123rd St
- 16402 W 123rd St
- 16330 W 123rd St
- 16424 W 123rd St
- r W 123rd St
- 16336 W 123rd St
- 16430 W 123rd St
- 16324 W 123rd St
- 16342 W 123rd St
- 16401 W 123rd St
- 16506 W 123rd St
- 16500 W 123rd St
- 16439 W 123rd St
- 16320 W 123rd St
- 16437 W 123rd St
- 16314 W 123rd St
- 16318 W 123rd St
- 16308 W 123rd St
- 16319 W 123rd St