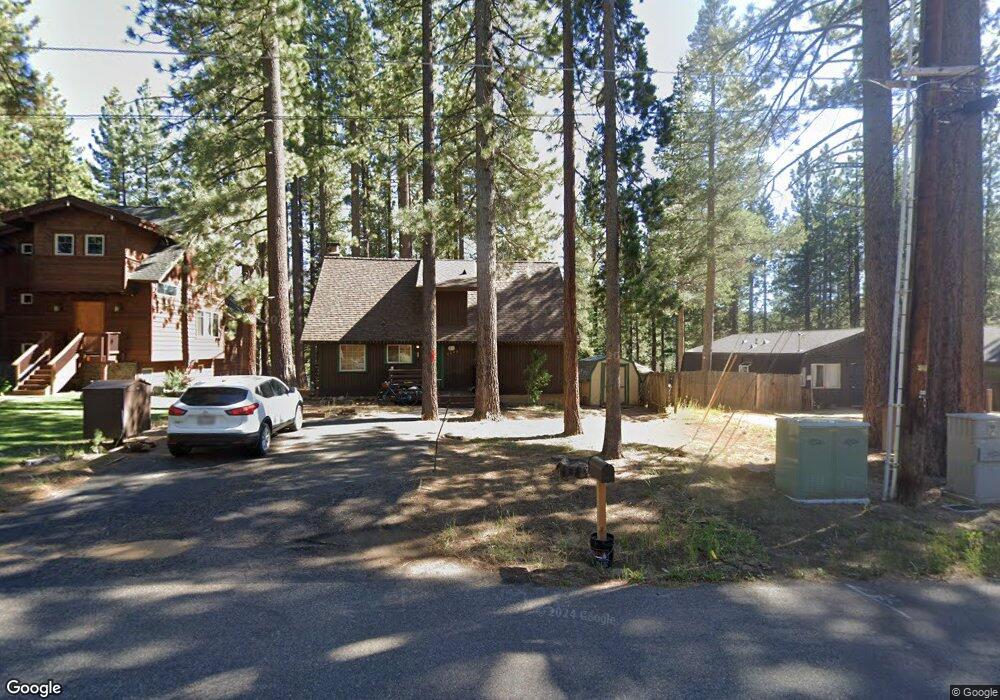
1642 Oglala St South Lake Tahoe, CA 96150
Estimated Value: $550,000 - $689,000
3
Beds
2
Baths
1,522
Sq Ft
$412/Sq Ft
Est. Value
About This Home
This home is located at 1642 Oglala St, South Lake Tahoe, CA 96150 and is currently estimated at $627,294, approximately $412 per square foot. 1642 Oglala St is a home located in El Dorado County with nearby schools including Sierra House Elementary School, South Tahoe Middle School, and South Tahoe High School.
Ownership History
Date
Name
Owned For
Owner Type
Purchase Details
Closed on
Jul 10, 2013
Sold by
Pulido Armando A
Bought by
Pulido Armando A and The Armando A Pulido Revocable
Current Estimated Value
Purchase Details
Closed on
Jul 29, 2003
Sold by
Kulisek Michael L and Kulisek Delia Y
Bought by
Pulido Armando A and Pulido Merrille Collette
Purchase Details
Closed on
Mar 15, 2002
Sold by
Kulisek Delia Y and Madrigal Delia Y
Bought by
Kulisek Michael L and Kulisek Delia Y
Home Financials for this Owner
Home Financials are based on the most recent Mortgage that was taken out on this home.
Original Mortgage
$187,500
Interest Rate
6.85%
Purchase Details
Closed on
Jan 13, 1999
Sold by
Kulisek Michael Louis
Bought by
Madrigal Delia Y
Home Financials for this Owner
Home Financials are based on the most recent Mortgage that was taken out on this home.
Original Mortgage
$120,150
Interest Rate
6.66%
Create a Home Valuation Report for This Property
The Home Valuation Report is an in-depth analysis detailing your home's value as well as a comparison with similar homes in the area
Home Values in the Area
Average Home Value in this Area
Purchase History
| Date | Buyer | Sale Price | Title Company |
|---|---|---|---|
| Pulido Armando A | -- | None Available | |
| Pulido Armando A | $309,000 | Placer Title Co | |
| Kulisek Michael L | -- | Fidelity National Title Co | |
| Madrigal Delia Y | -- | First American Title Ins Co | |
| Madrigal Delia Y | $126,500 | First American Title Ins Co |
Source: Public Records
Mortgage History
| Date | Status | Borrower | Loan Amount |
|---|---|---|---|
| Previous Owner | Kulisek Michael L | $187,500 | |
| Previous Owner | Madrigal Delia Y | $120,150 |
Source: Public Records
Tax History Compared to Growth
Tax History
| Year | Tax Paid | Tax Assessment Tax Assessment Total Assessment is a certain percentage of the fair market value that is determined by local assessors to be the total taxable value of land and additions on the property. | Land | Improvement |
|---|---|---|---|---|
| 2025 | $4,680 | $439,309 | $156,385 | $282,924 |
| 2024 | $4,680 | $430,696 | $153,319 | $277,377 |
| 2023 | $4,599 | $422,252 | $150,313 | $271,939 |
| 2022 | $4,554 | $413,973 | $147,366 | $266,607 |
| 2021 | $4,481 | $405,857 | $144,477 | $261,380 |
| 2020 | $4,420 | $401,696 | $142,996 | $258,700 |
| 2019 | $4,398 | $393,821 | $140,193 | $253,628 |
| 2018 | $4,301 | $386,100 | $137,445 | $248,655 |
| 2017 | $4,234 | $378,530 | $134,750 | $243,780 |
| 2016 | $3,631 | $323,500 | $88,500 | $235,000 |
| 2015 | $3,646 | $323,500 | $88,500 | $235,000 |
| 2014 | $3,508 | $318,000 | $87,500 | $230,500 |
Source: Public Records
Map
Nearby Homes
- 1617 Cree St
- 1656 Oglala St
- 1589 Cree St
- 1713 Tionontati St
- 1678 Tionontati St
- 1513 Cree St
- 1567 Ojibwa St
- 1670 Canienaga St
- 1671 Crystal Air Dr
- 1594 Canienaga St
- 1644 Crystal Air Dr
- 1540 Ojibwa St
- 1952 Osage Cir
- 1579 Crystal Air Dr
- 1575 Crystal Air Dr
- 1578 Skyline Dr
- 1593 Plumas Cir
- 1442 Vanderhoof Rd
- 1431 Vanderhoof Rd
- 1876 Bella Coola Dr
- 1636 Oglala St
- 1646 Oglala St
- 1632 Oglala St
- 1639 Zapotec Dr
- 1652 Oglala St
- 1645 Oglala St
- 1807 Ababco St
- 1812 Saponi St
- 1620 Oglala St
- 1629 Oglala St
- 1806 Ababco St
- 1806 Saponi St
- 1640 Zapotec Dr
- 1614 Oglala St
- 1666 Oglala St
- 1802 Saponi St
- 1799 Ababco St
- 1615 Zapotec Dr
- 1621 Oglala St
- 1610 Oglala St