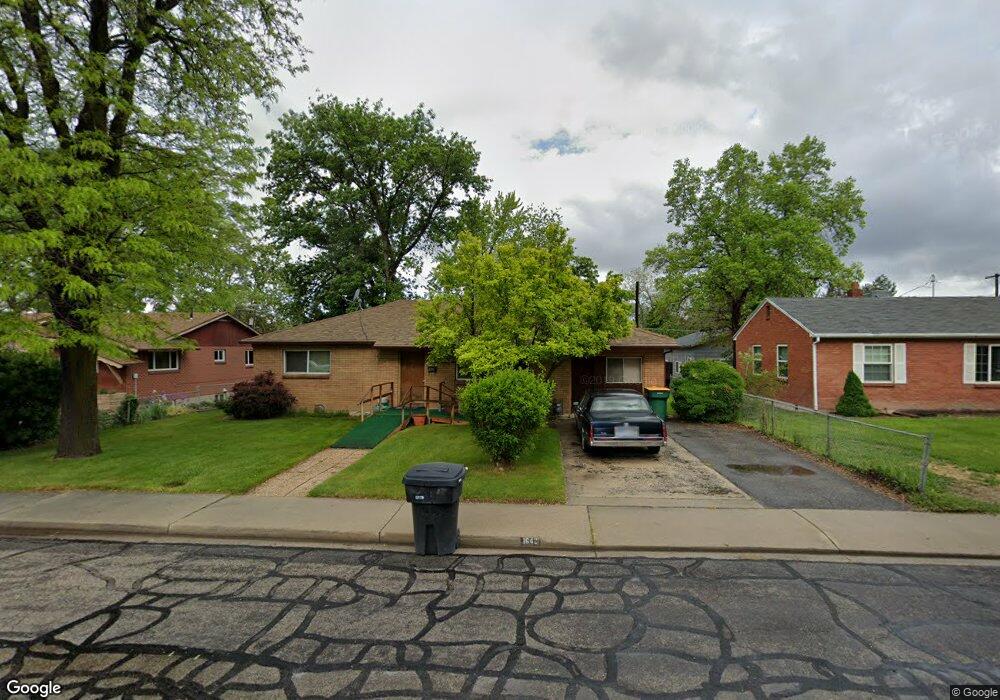
1642 S 50 E Orem, UT 84058
Cherry Hill NeighborhoodEstimated Value: $430,769 - $488,000
4
Beds
1
Bath
1,276
Sq Ft
$363/Sq Ft
Est. Value
About This Home
This home is located at 1642 S 50 E, Orem, UT 84058 and is currently estimated at $463,256, approximately $363 per square foot. 1642 S 50 E is a home located in Utah County with nearby schools including Cherry Hill Elementary School, Lakeridge Jr High School, and Mountain View High School.
Ownership History
Date
Name
Owned For
Owner Type
Purchase Details
Closed on
Dec 28, 2017
Sold by
Alder Ludean Bailey and Ludean Bailey Alder Trust
Bought by
Alder Craig Zane and Craig Zane Alder Trust
Current Estimated Value
Purchase Details
Closed on
Sep 14, 2004
Sold by
Alder Ludean B
Bought by
Alder Ludean Bailey and Ludean Bailey Alder Trust
Create a Home Valuation Report for This Property
The Home Valuation Report is an in-depth analysis detailing your home's value as well as a comparison with similar homes in the area
Home Values in the Area
Average Home Value in this Area
Purchase History
| Date | Buyer | Sale Price | Title Company |
|---|---|---|---|
| Alder Craig Zane | -- | Eagle Gate Title Ins Agency | |
| Alder Ludean Bailey | -- | -- |
Source: Public Records
Tax History
| Year | Tax Paid | Tax Assessment Tax Assessment Total Assessment is a certain percentage of the fair market value that is determined by local assessors to be the total taxable value of land and additions on the property. | Land | Improvement |
|---|---|---|---|---|
| 2025 | $1,596 | $205,535 | -- | -- |
| 2024 | $1,596 | $195,140 | $0 | $0 |
| 2023 | $1,448 | $190,355 | $0 | $0 |
| 2022 | $1,495 | $190,410 | $0 | $0 |
| 2021 | $1,262 | $243,400 | $134,400 | $109,000 |
| 2020 | $1,125 | $213,300 | $107,500 | $105,800 |
| 2019 | $971 | $191,400 | $93,200 | $98,200 |
| 2018 | $929 | $190,000 | $89,600 | $100,400 |
| 2017 | $925 | $93,335 | $0 | $0 |
| 2016 | $935 | $87,010 | $0 | $0 |
| 2015 | $931 | $81,895 | $0 | $0 |
| 2014 | $883 | $77,330 | $0 | $0 |
Source: Public Records
Map
Nearby Homes
Your Personal Tour Guide
Ask me questions while you tour the home.