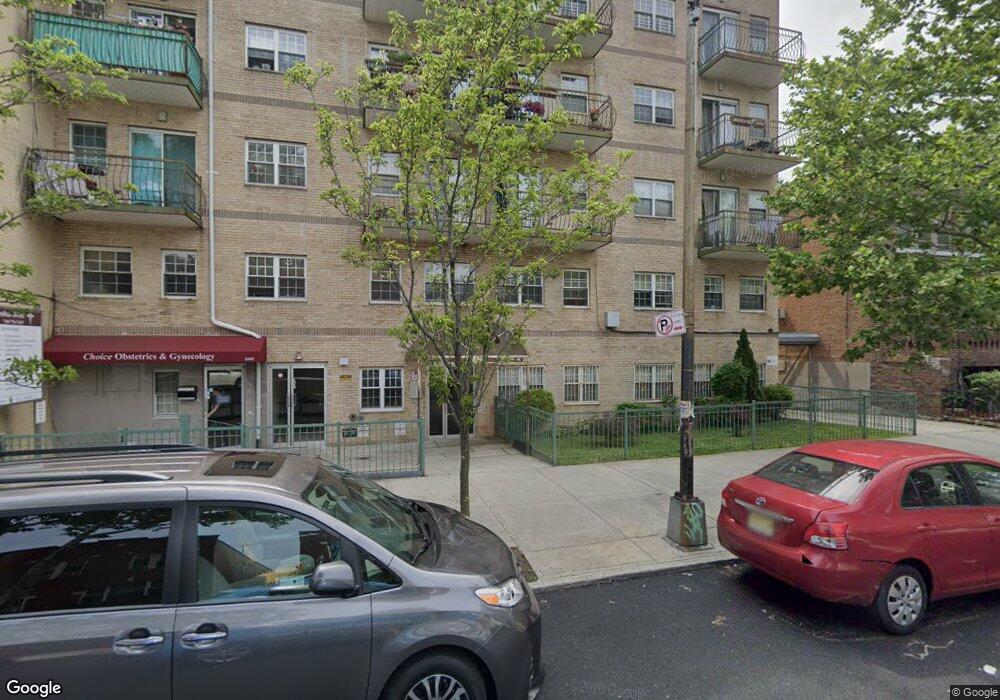
1642 W 9th St Unit 2A Brooklyn, NY 11223
Gravesend NeighborhoodEstimated Value: $454,000 - $751,000
Studio
--
Bath
830
Sq Ft
$680/Sq Ft
Est. Value
About This Home
This home is located at 1642 W 9th St Unit 2A, Brooklyn, NY 11223 and is currently estimated at $564,587, approximately $680 per square foot. 1642 W 9th St Unit 2A is a home located in Kings County with nearby schools including P.S.177 The Marlboro, Seth Low Intermediate School 96, and James Madison High School.
Ownership History
Date
Name
Owned For
Owner Type
Purchase Details
Closed on
Jan 9, 2013
Sold by
Chen Shi Ying
Bought by
Chen Shi Ying
Current Estimated Value
Purchase Details
Closed on
Jan 16, 2012
Sold by
Chen Shi Ying
Bought by
Chen Shi Ying and Yu Yanwen
Purchase Details
Closed on
Sep 16, 2009
Sold by
Choi Leung Kai
Bought by
Chen Shi Ying
Home Financials for this Owner
Home Financials are based on the most recent Mortgage that was taken out on this home.
Original Mortgage
$150,000
Interest Rate
5.31%
Mortgage Type
Purchase Money Mortgage
Purchase Details
Closed on
Apr 26, 2005
Sold by
268 Development Inc
Bought by
Choi Leung Kai
Home Financials for this Owner
Home Financials are based on the most recent Mortgage that was taken out on this home.
Original Mortgage
$220,000
Interest Rate
6.05%
Mortgage Type
Purchase Money Mortgage
Create a Home Valuation Report for This Property
The Home Valuation Report is an in-depth analysis detailing your home's value as well as a comparison with similar homes in the area
Home Values in the Area
Average Home Value in this Area
Purchase History
| Date | Buyer | Sale Price | Title Company |
|---|---|---|---|
| Chen Shi Ying | $100,000 | -- | |
| Chen Shi Ying | -- | -- | |
| Chen Shi Ying | $310,000 | -- | |
| Choi Leung Kai | $314,415 | -- |
Source: Public Records
Mortgage History
| Date | Status | Borrower | Loan Amount |
|---|---|---|---|
| Previous Owner | Chen Shi Ying | $150,000 | |
| Previous Owner | Choi Leung Kai | $220,000 |
Source: Public Records
Tax History
| Year | Tax Paid | Tax Assessment Tax Assessment Total Assessment is a certain percentage of the fair market value that is determined by local assessors to be the total taxable value of land and additions on the property. | Land | Improvement |
|---|---|---|---|---|
| 2025 | $5,374 | $43,954 | $4,839 | $39,115 |
| 2024 | $5,374 | $43,355 | $4,839 | $38,516 |
| 2023 | $3,682 | $41,742 | $4,839 | $36,903 |
| 2022 | $3,716 | $47,840 | $4,839 | $43,001 |
| 2021 | $4,730 | $38,558 | $4,839 | $33,719 |
| 2020 | $1,877 | $39,488 | $4,839 | $34,649 |
| 2019 | $2,772 | $39,488 | $4,839 | $34,649 |
| 2018 | $1,776 | $41,907 | $4,839 | $37,068 |
| 2017 | $889 | $34,816 | $4,839 | $29,977 |
| 2016 | $198 | $33,017 | $4,839 | $28,178 |
| 2015 | $155 | $28,799 | $4,855 | $23,944 |
| 2014 | $155 | $24,478 | $4,839 | $19,639 |
Source: Public Records
Map
Nearby Homes
- 1642 W 9th St Unit 3B
- 1639 W 9th St
- 1652 W 8th St
- 168 Avenue P Unit 8C
- 1645 W 11th St
- 1651 W 11th St
- 157 Avenue P Unit 2A
- 226 Kings Hwy
- 74 Quentin Rd
- 1653 W 7th St Unit 1F
- 100 Avenue P Unit 4K
- 1683 W 7th St Unit 2B
- 1683 W 7th St Unit 3A
- 1683 W 7th St Unit 3B
- 1683 W 7th St Unit 4B
- 1683 W 7th St Unit 5-B
- 1739 W 9th St
- 1735 W 11th St
- 80 Avenue P Unit D14
- 284 Kings Hwy
- 1642 W 9th St Unit 6D
- 1642 W 9th St Unit 6C
- 1642 W 9th St Unit 6B
- 1642 W 9th St Unit 6A
- 1642 W 9th St Unit 5D
- 1642 W 9th St Unit 5C
- 1642 W 9th St Unit 5B
- 1642 W 9th St Unit 5A
- 1642 W 9th St Unit 4D
- 1642 W 9th St Unit 4C
- 1642 W 9th St Unit 4B
- 1642 W 9th St Unit 4A
- 1642 W 9th St Unit 3D
- 1642 W 9th St Unit 3C
- 1642 W 9th St Unit 3A
- 1642 W 9th St Unit 2D
- 1642 W 9th St Unit 2C
- 1642 W 9th St Unit 2B
- 1642 W 9th St Unit 1A
- 1642 W 9 St Unit 4c
Your Personal Tour Guide
Ask me questions while you tour the home.