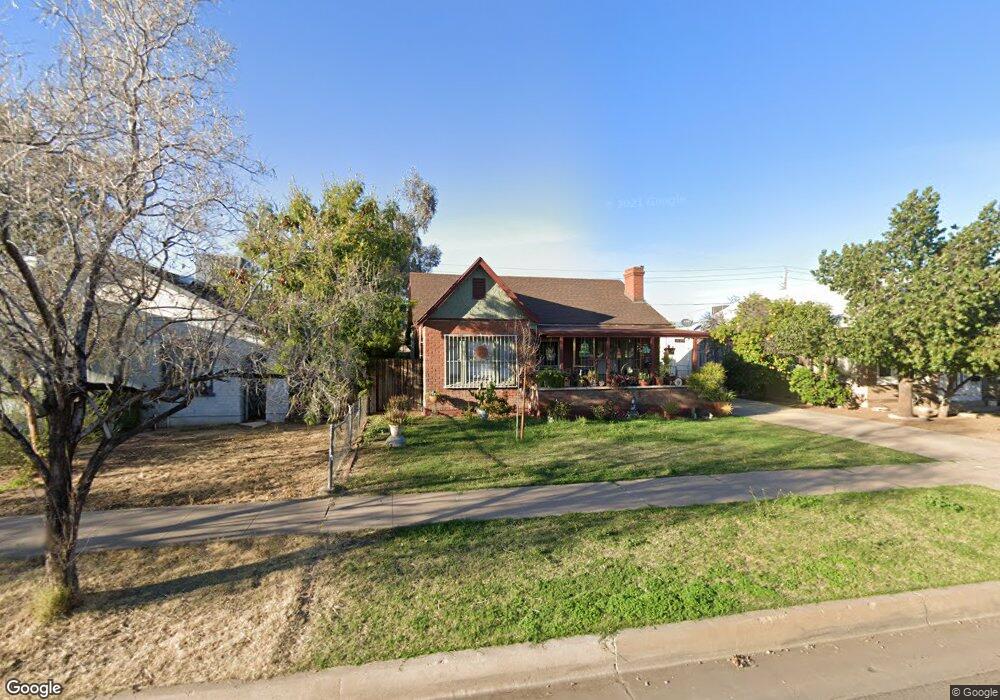
1642 W Taylor St Phoenix, AZ 85007
Governmental Mall NeighborhoodEstimated Value: $256,000 - $379,000
3
Beds
1
Bath
1,092
Sq Ft
$284/Sq Ft
Est. Value
About This Home
This home is located at 1642 W Taylor St, Phoenix, AZ 85007 and is currently estimated at $310,341, approximately $284 per square foot. 1642 W Taylor St is a home located in Maricopa County with nearby schools including Capitol Elementary School, Phoenix Coding Academy, and Central High School.
Ownership History
Date
Name
Owned For
Owner Type
Purchase Details
Closed on
Nov 11, 2003
Sold by
Mullen Henrietta G
Bought by
Sivolella Kate
Current Estimated Value
Home Financials for this Owner
Home Financials are based on the most recent Mortgage that was taken out on this home.
Original Mortgage
$78,300
Outstanding Balance
$35,339
Interest Rate
5.62%
Mortgage Type
Purchase Money Mortgage
Estimated Equity
$275,002
Purchase Details
Closed on
Sep 5, 1998
Sold by
Avila Irma Y
Bought by
Avila Nery
Home Financials for this Owner
Home Financials are based on the most recent Mortgage that was taken out on this home.
Original Mortgage
$64,900
Interest Rate
6.92%
Purchase Details
Closed on
Aug 28, 1998
Sold by
Bran Maria Olga
Bought by
Bran Maria Olga and Avila Nery
Home Financials for this Owner
Home Financials are based on the most recent Mortgage that was taken out on this home.
Original Mortgage
$64,900
Interest Rate
6.92%
Purchase Details
Closed on
Dec 6, 1996
Sold by
Mullen Henrietta G
Bought by
Mullen Henrietta G and Henrietta G Mullen Living Trust
Create a Home Valuation Report for This Property
The Home Valuation Report is an in-depth analysis detailing your home's value as well as a comparison with similar homes in the area
Home Values in the Area
Average Home Value in this Area
Purchase History
| Date | Buyer | Sale Price | Title Company |
|---|---|---|---|
| Sivolella Kate | $87,000 | Security Title Agency | |
| Avila Nery | -- | Fidelity Title | |
| Bran Maria Olga | -- | Fidelity Title | |
| Mullen Henrietta G | -- | -- |
Source: Public Records
Mortgage History
| Date | Status | Borrower | Loan Amount |
|---|---|---|---|
| Open | Sivolella Kate | $78,300 | |
| Previous Owner | Bran Maria Olga | $64,900 |
Source: Public Records
Tax History Compared to Growth
Tax History
| Year | Tax Paid | Tax Assessment Tax Assessment Total Assessment is a certain percentage of the fair market value that is determined by local assessors to be the total taxable value of land and additions on the property. | Land | Improvement |
|---|---|---|---|---|
| 2025 | $521 | $3,895 | -- | -- |
| 2024 | $516 | $3,710 | -- | -- |
| 2023 | $516 | $26,030 | $5,200 | $20,830 |
| 2022 | $498 | $20,660 | $4,130 | $16,530 |
| 2021 | $494 | $17,880 | $3,570 | $14,310 |
| 2020 | $499 | $15,000 | $3,000 | $12,000 |
| 2019 | $1,348 | $10,910 | $2,180 | $8,730 |
| 2018 | $490 | $8,260 | $1,650 | $6,610 |
| 2017 | $479 | $5,920 | $1,180 | $4,740 |
| 2016 | $465 | $5,360 | $1,070 | $4,290 |
| 2015 | $430 | $4,560 | $910 | $3,650 |
Source: Public Records
Map
Nearby Homes
- 415 N 17th Dr
- 329 N 17th Dr
- 325 N 17th Dr
- 1522 W Fillmore St
- 1522 W Fillmore St Unit 6-7
- 1830 W Fillmore St Unit 3
- 334 N 18th Dr
- 1330 W Fillmore St
- 1322 W Taylor St
- 1315 W Woodland Ave
- 1322 W Monroe St
- 1711 W Latham St
- 1130 W Fillmore St
- 1945 W Van Buren St
- 1913 W Adams St
- 2002 W Adams St
- 116 N 11th Ave Unit 1 & 2
- 1126 W Portland St
- 1941 W Washington St Unit 9
- 1606 W Culver St
- 1638 W Taylor St
- 1646 W Taylor St
- 1646 W Taylor St Unit 1
- 1634 W Taylor St
- 435 N 17th Ave
- 1630 W Taylor St
- 436 N 17th Ave
- 1641 W Taylor St
- 1637 W Taylor St
- 1645 W Taylor St
- 1626 W Taylor St
- 1629 W Fillmore St
- 1629 W Fillmore St Unit 7
- 1629 W Fillmore St Unit 6
- 1633 W Taylor St
- 426 N 17th Ave Unit 1
- 426 N 17th Ave
- 422 N 17th Ave
- 1629 W Taylor St
- 1622 W Taylor St