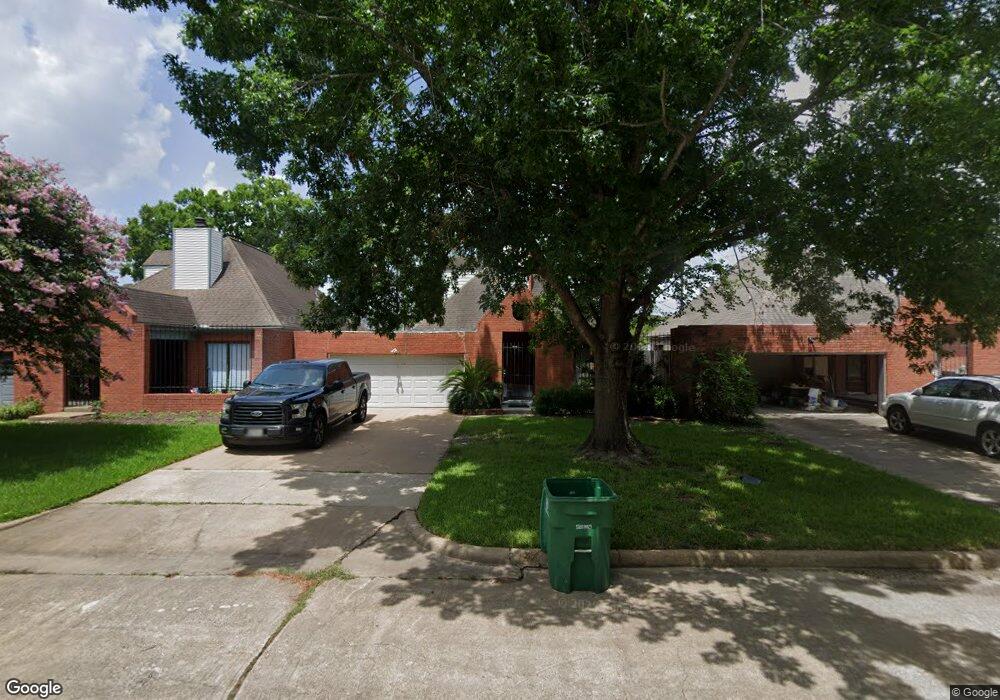
1643 Gingerleaf Ln Houston, TX 77055
Spring Branch East NeighborhoodEstimated Value: $371,515 - $476,000
3
Beds
2
Baths
1,594
Sq Ft
$256/Sq Ft
Est. Value
About This Home
This home is located at 1643 Gingerleaf Ln, Houston, TX 77055 and is currently estimated at $408,629, approximately $256 per square foot. 1643 Gingerleaf Ln is a home located in Harris County with nearby schools including Valley Oaks Elementary School, Landrum Middle School, and Memorial High School.
Ownership History
Date
Name
Owned For
Owner Type
Purchase Details
Closed on
Oct 29, 1999
Sold by
Muncie David Boyd and Muncie Chi Min
Bought by
Totonchian Nida and Hashemi Sayed E
Current Estimated Value
Home Financials for this Owner
Home Financials are based on the most recent Mortgage that was taken out on this home.
Original Mortgage
$80,000
Outstanding Balance
$24,461
Interest Rate
7.77%
Estimated Equity
$384,168
Purchase Details
Closed on
Sep 30, 1999
Sold by
Clerk United States District Court
Bought by
Muncie David Boyd and Muncie Chi Min
Home Financials for this Owner
Home Financials are based on the most recent Mortgage that was taken out on this home.
Original Mortgage
$80,000
Outstanding Balance
$24,461
Interest Rate
7.77%
Estimated Equity
$384,168
Purchase Details
Closed on
Sep 16, 1998
Sold by
Muncie David and Muncie Chi Min Wang
Bought by
United States District Court
Purchase Details
Closed on
Sep 12, 1994
Sold by
Muncie Joan Stewart
Bought by
Muncie David Boyd and Muncie Chi Min
Create a Home Valuation Report for This Property
The Home Valuation Report is an in-depth analysis detailing your home's value as well as a comparison with similar homes in the area
Home Values in the Area
Average Home Value in this Area
Purchase History
| Date | Buyer | Sale Price | Title Company |
|---|---|---|---|
| Totonchian Nida | -- | Regency Title Company | |
| Muncie David Boyd | -- | Regency Title Company | |
| United States District Court | -- | Stewart Title Company | |
| Muncie David Boyd | -- | -- |
Source: Public Records
Mortgage History
| Date | Status | Borrower | Loan Amount |
|---|---|---|---|
| Open | Totonchian Nida | $80,000 |
Source: Public Records
Tax History
| Year | Tax Paid | Tax Assessment Tax Assessment Total Assessment is a certain percentage of the fair market value that is determined by local assessors to be the total taxable value of land and additions on the property. | Land | Improvement |
|---|---|---|---|---|
| 2025 | $8,084 | $366,761 | $218,850 | $147,911 |
| 2024 | $8,084 | $366,761 | $218,850 | $147,911 |
| 2023 | $8,084 | $386,929 | $218,850 | $168,079 |
| 2022 | $8,929 | $366,248 | $196,965 | $169,283 |
| 2021 | $7,448 | $305,080 | $175,080 | $130,000 |
| 2020 | $7,949 | $305,080 | $175,080 | $130,000 |
| 2019 | $8,292 | $305,080 | $175,080 | $130,000 |
| 2018 | $3,733 | $305,080 | $175,080 | $130,000 |
| 2017 | $7,981 | $305,080 | $175,080 | $130,000 |
| 2016 | $7,981 | $305,080 | $175,080 | $130,000 |
| 2015 | $2,572 | $247,276 | $131,310 | $115,966 |
| 2014 | $2,572 | $130,600 | $26,262 | $104,338 |
Source: Public Records
Map
Nearby Homes
- 1739 French Village Dr
- 7921 Westwood Dr
- 1523 Cunningham Parc Ln
- 0 Wirt Rd
- 7905 Westwood Dr
- 1717 Monarch Oaks St
- 1529 Wirt Rd Unit 27
- 1614 Lynnview Dr
- 1614 Johanna Dr Unit D
- 1619 Lynnview Dr
- 1611 Lynnview Dr
- 1834 Woodbend Village Ct
- 8213 Cabernet Ln
- 1503 Johanna Dr
- 1825 Huge Oaks St
- 1720 Huge Oaks St
- 8707 Padua Ln
- 1740 Cove Crescent Ct
- 7827 Shady Villa Cove
- 3107 Somerset Levens Ln
- 1703 Gingerleaf Ln
- 1639 Gingerleaf Ln
- 1707 Gingerleaf Ln
- 1635 Gingerleaf Ln
- 1711 Gingerleaf Ln
- 1631 Gingerleaf Ln
- 1715 Gingerleaf Ln
- 7935 N Wellington Ct
- 1627 Gingerleaf Ln
- 7934 S Wellington Ct
- 1618 Glourie Dr
- 1622 Glourie Dr
- 7938 N Wellington Ct
- 1719 Gingerleaf Ln
- 1623 Gingerleaf Ln
- 7931 N Wellington Ct
- 7930 S Wellington Ct
- 1626 Glourie Dr
- 1723 Gingerleaf Ln
- 1619 Gingerleaf Ln
Your Personal Tour Guide
Ask me questions while you tour the home.