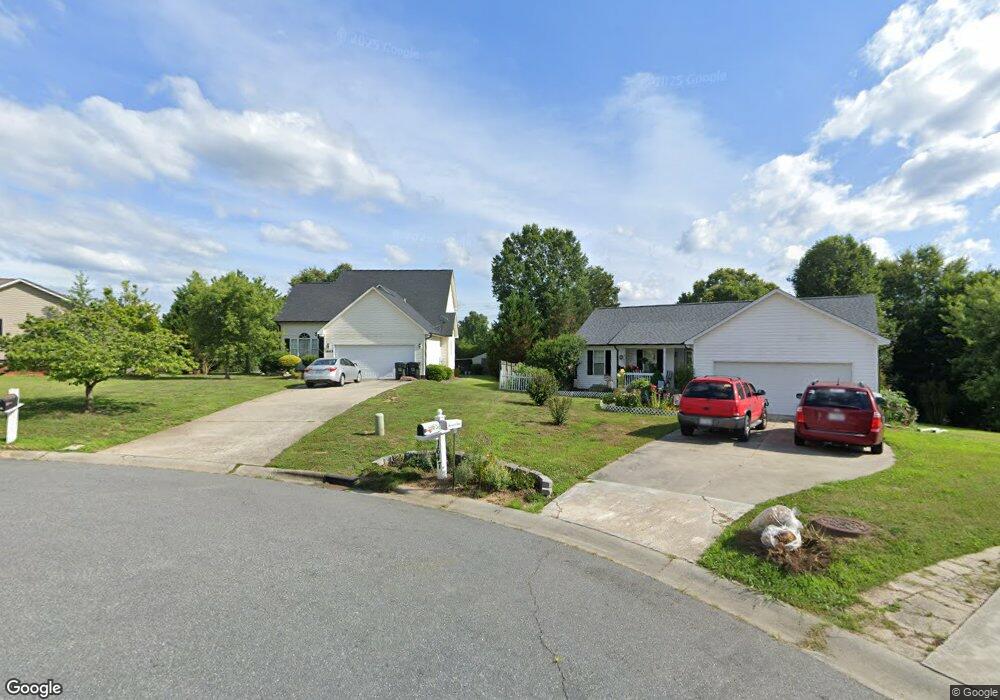
1643 Marmot Place Concord, NC 28025
Estimated Value: $333,000 - $370,000
3
Beds
3
Baths
1,618
Sq Ft
$215/Sq Ft
Est. Value
About This Home
This home is located at 1643 Marmot Place, Concord, NC 28025 and is currently estimated at $347,891, approximately $215 per square foot. 1643 Marmot Place is a home located in Cabarrus County with nearby schools including W.M. Irvin Elementary School, Mount Pleasant Middle School, and Mount Pleasant High School.
Ownership History
Date
Name
Owned For
Owner Type
Purchase Details
Closed on
Sep 18, 2014
Sold by
Cress Sheila Dawn
Bought by
Cress Gary Lee
Current Estimated Value
Purchase Details
Closed on
Apr 5, 2006
Sold by
Robinson Darrin P and Robinson Angela D
Bought by
Cress Gary L
Home Financials for this Owner
Home Financials are based on the most recent Mortgage that was taken out on this home.
Original Mortgage
$29,700
Outstanding Balance
$10,897
Interest Rate
6.2%
Mortgage Type
Credit Line Revolving
Estimated Equity
$336,994
Purchase Details
Closed on
Aug 20, 2001
Sold by
Horton John R and Horton Kelly P
Bought by
Robinson Darrin P and Robinson Angela D
Home Financials for this Owner
Home Financials are based on the most recent Mortgage that was taken out on this home.
Original Mortgage
$129,972
Interest Rate
7.19%
Mortgage Type
FHA
Create a Home Valuation Report for This Property
The Home Valuation Report is an in-depth analysis detailing your home's value as well as a comparison with similar homes in the area
Home Values in the Area
Average Home Value in this Area
Purchase History
| Date | Buyer | Sale Price | Title Company |
|---|---|---|---|
| Cress Gary Lee | -- | None Available | |
| Cress Gary L | $148,500 | None Available | |
| Robinson Darrin P | $131,000 | -- |
Source: Public Records
Mortgage History
| Date | Status | Borrower | Loan Amount |
|---|---|---|---|
| Open | Cress Gary L | $29,700 | |
| Open | Cress Gary L | $118,800 | |
| Previous Owner | Robinson Darrin P | $129,972 |
Source: Public Records
Tax History Compared to Growth
Tax History
| Year | Tax Paid | Tax Assessment Tax Assessment Total Assessment is a certain percentage of the fair market value that is determined by local assessors to be the total taxable value of land and additions on the property. | Land | Improvement |
|---|---|---|---|---|
| 2025 | $3,121 | $313,330 | $67,000 | $246,330 |
| 2024 | $3,121 | $313,330 | $67,000 | $246,330 |
| 2023 | $2,031 | $166,450 | $32,000 | $134,450 |
| 2022 | $2,031 | $164,740 | $32,000 | $132,740 |
| 2021 | $2,010 | $164,740 | $32,000 | $132,740 |
| 2020 | $2,010 | $164,740 | $32,000 | $132,740 |
| 2019 | $1,771 | $145,130 | $28,750 | $116,380 |
| 2018 | $1,742 | $145,130 | $28,750 | $116,380 |
| 2017 | $1,654 | $140,140 | $28,750 | $111,390 |
| 2016 | $981 | $134,760 | $28,750 | $106,010 |
| 2015 | $1,590 | $134,760 | $28,750 | $106,010 |
| 2014 | $1,590 | $134,760 | $28,750 | $106,010 |
Source: Public Records
Map
Nearby Homes
- 1695 Lemming Dr
- 1665 Red Bird Cir
- 2911 Buffalo Hills Dr
- 2314 Fairport Dr SE
- 1930 Cold Springs Rd
- 2365 Baxter Place SE
- 2625 Old Airport Rd
- 2369 Baxter Place SE
- 2817 Allendale Ct
- 1508 Thompson Dr
- 1146 Crestmont Dr SE
- 1076 Tangle Ridge Dr SE
- 5200 Fieldstone Dr
- 1128 Tangle Ridge Dr SE
- 3261 Fairmead Dr
- 2406 Everton Cir SE
- 368 Pleasant Hill Dr SE
- 4240 Nc Hwy 73 None E
- 832 Oak Manor Dr
- 43 Crane Ct
- 1643 Marmot Point
- 1639 Marmot Place
- 1647 Marmot Place
- 1646 Marmot Place SE
- 4180 Ringtail Ct
- 1635 Marmot Place SE
- 1635 Marmot Place
- 4184 Ringtail Ct
- 1646 Marmot Place
- 1646 Marmot Place Unit 119
- 4184 Ringtail Ct SE
- 1642 Marmot Place
- 3643 Muskratt Place SE
- 4170 Ringtail Ct
- 4170 Ringtail Ct Unit 127
- 4158 Ringtail Ct SE
- 4158 Ringtail Ct
- 4158 Ringtail Ct Unit 126
- 4150 Ringtail Ct
- 1634 Marmot Place