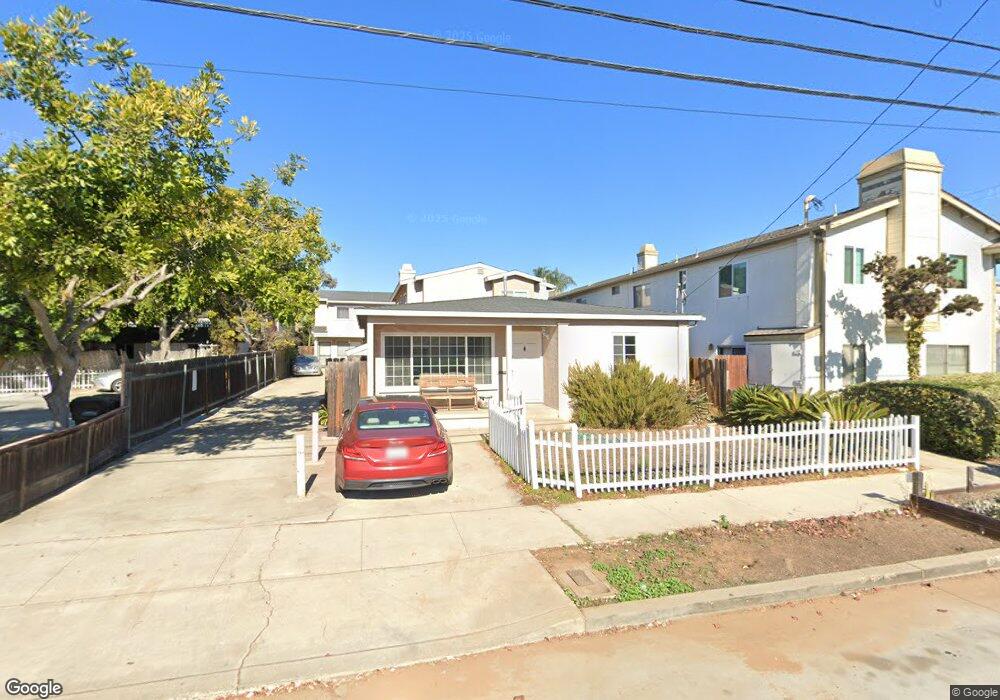
1644 Oliver Ave San Diego, CA 92109
Pacific Beach NeighborhoodEstimated Value: $702,706 - $817,000
2
Beds
1
Bath
846
Sq Ft
$925/Sq Ft
Est. Value
About This Home
This home is located at 1644 Oliver Ave, San Diego, CA 92109 and is currently estimated at $782,927, approximately $925 per square foot. 1644 Oliver Ave is a home located in San Diego County with nearby schools including Crown Point Junior Music Academy, Pacific Beach Middle, and Mission Bay High School.
Ownership History
Date
Name
Owned For
Owner Type
Purchase Details
Closed on
Jun 6, 2021
Sold by
Johnson Adam Mayhew
Bought by
Johnson Adam M and Rydberg Jenna L
Current Estimated Value
Purchase Details
Closed on
Jun 3, 2021
Sold by
Bridges Craig
Bought by
Bridges Craig and Craig Bridges Family Trust
Purchase Details
Closed on
Feb 12, 2014
Sold by
Wanner Donald and Wanner Lauren K
Bought by
Bridges Craig
Home Financials for this Owner
Home Financials are based on the most recent Mortgage that was taken out on this home.
Original Mortgage
$344,000
Outstanding Balance
$259,074
Interest Rate
4.25%
Mortgage Type
New Conventional
Estimated Equity
$523,853
Purchase Details
Closed on
Dec 29, 2006
Sold by
Ring Family Partnership #2 Lp
Bought by
Wanner Donald and Wanner Lauren K
Home Financials for this Owner
Home Financials are based on the most recent Mortgage that was taken out on this home.
Original Mortgage
$95,000
Interest Rate
5.82%
Mortgage Type
Credit Line Revolving
Create a Home Valuation Report for This Property
The Home Valuation Report is an in-depth analysis detailing your home's value as well as a comparison with similar homes in the area
Home Values in the Area
Average Home Value in this Area
Purchase History
| Date | Buyer | Sale Price | Title Company |
|---|---|---|---|
| Johnson Adam M | -- | None Available | |
| Bridges Craig | -- | None Available | |
| Bridges Craig | $430,000 | Equity Title | |
| Wanner Donald | $380,000 | Chicago Title Co |
Source: Public Records
Mortgage History
| Date | Status | Borrower | Loan Amount |
|---|---|---|---|
| Open | Bridges Craig | $344,000 | |
| Previous Owner | Wanner Donald | $95,000 | |
| Previous Owner | Wanner Donald | $285,000 |
Source: Public Records
Tax History Compared to Growth
Tax History
| Year | Tax Paid | Tax Assessment Tax Assessment Total Assessment is a certain percentage of the fair market value that is determined by local assessors to be the total taxable value of land and additions on the property. | Land | Improvement |
|---|---|---|---|---|
| 2025 | $6,378 | $527,110 | $385,545 | $141,565 |
| 2024 | $6,378 | $516,776 | $377,986 | $138,790 |
| 2023 | $6,238 | $506,644 | $370,575 | $136,069 |
| 2022 | $6,072 | $496,710 | $363,309 | $133,401 |
| 2021 | $6,031 | $486,972 | $356,186 | $130,786 |
| 2020 | $5,958 | $481,979 | $352,534 | $129,445 |
| 2019 | $5,852 | $472,529 | $345,622 | $126,907 |
| 2018 | $5,472 | $463,265 | $338,846 | $124,419 |
| 2017 | $80 | $454,182 | $332,202 | $121,980 |
| 2016 | $5,257 | $445,278 | $325,689 | $119,589 |
| 2015 | $5,180 | $438,590 | $320,797 | $117,793 |
| 2014 | $4,073 | $350,000 | $256,000 | $94,000 |
Source: Public Records
Map
Nearby Homes
- 1654 Oliver Ave Unit 6
- 4053-55 Jewell St
- 4037 Haines St
- 4073 Riviera Dr
- 4071 Riviera Dr
- 1300 Grand Ave Unit 38, 39
- 3968 Sequoia St
- 1341 Thomas Ave
- 4135 Fanuel St
- 3920 Riviera Dr Unit A
- 1278 Pacific Beach Dr Unit 3
- 1434-44 Garnet Ave
- 1951 Hornblend St Unit 55
- 3888 Riviera Dr Unit 206
- 3955 Honeycutt St Unit 201
- 1956 Hornblend St Unit 8
- 2028 Thomas Ave Unit 32
- 3843 Riviera Dr Unit 1
- 3825 Kendall St
- 1235 Parker Place Unit 2B
- 1648 Oliver Ave Unit 1
- 1646 Oliver Ave
- 1648 Oliver Ave Unit 3
- 1654 Oliver Ave Unit 8
- 1654 Oliver Ave Unit 7
- 1654 Oliver Ave Unit 5
- 1652 Oliver Ave Unit 2
- 1652 Oliver Ave Unit 4
- 1652 Oliver Ave Unit 3
- 1652 Oliver Ave Unit 1
- 1636 Oliver Ave Unit 38
- 1626 Oliver Ave Unit 30
- 1643 Reed Ave
- 1649 Reed Ave
- 1653 Reed Ave
- 1614 Oliver Ave Unit 20
- 1663 Oliver Ave
- 1643 Oliver Ave
- 1651 Oliver Ave
- 1637 Oliver Ave Unit 39