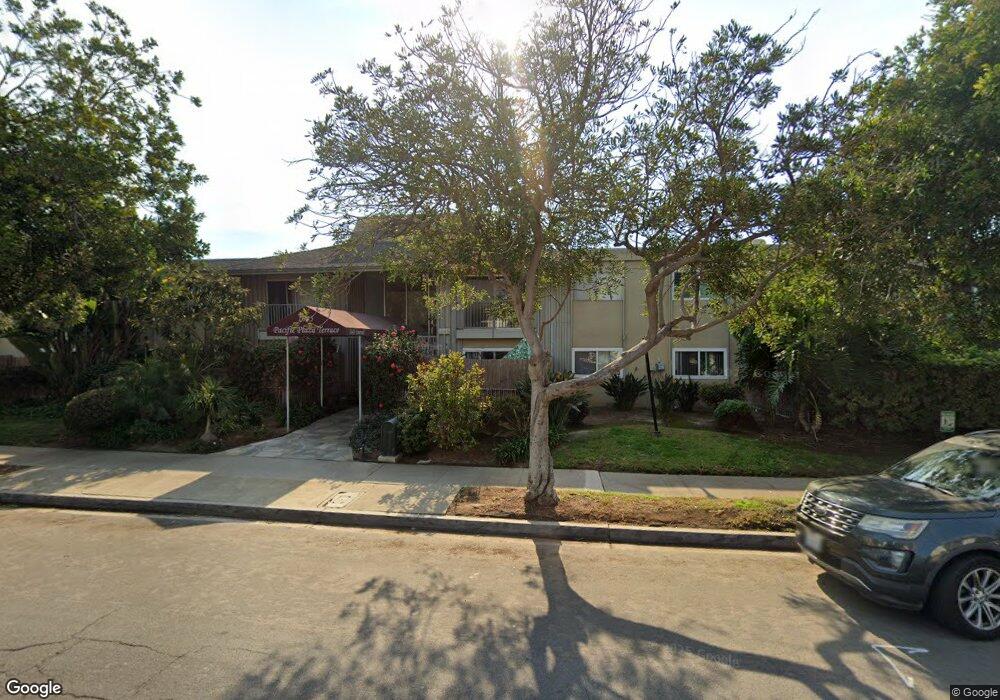
Pacific Plaza Terrace 1645 Emerald St Unit 2D San Diego, CA 92109
Pacific Beach NeighborhoodEstimated Value: $477,000 - $509,000
1
Bed
1
Bath
650
Sq Ft
$761/Sq Ft
Est. Value
About This Home
This home is located at 1645 Emerald St Unit 2D, San Diego, CA 92109 and is currently estimated at $494,488, approximately $760 per square foot. 1645 Emerald St Unit 2D is a home located in San Diego County with nearby schools including Pacific Beach Elementary School, Pacific Beach Middle, and Mission Bay High School.
Ownership History
Date
Name
Owned For
Owner Type
Purchase Details
Closed on
Jul 25, 2022
Sold by
Kathleen Theresa Baczynski Revocable Tru
Bought by
Baczynski Kathleen Theresa and Zito Christine R
Current Estimated Value
Purchase Details
Closed on
Oct 20, 2016
Sold by
Zito Christine R
Bought by
Zito Christine Rosemary and Isaac & Zito Revocable Trust
Purchase Details
Closed on
Oct 19, 2016
Sold by
Baczynski Kathleen Theresa
Bought by
Baczynski Kathleen Theresa and The Kathleen Baczynski Revocable Trust O
Purchase Details
Closed on
Aug 1, 2016
Sold by
Zito Christine R and Baczynski Kathleen T
Bought by
Baczynski Kathleen Theresa and Zito Christine R
Purchase Details
Closed on
Nov 19, 2012
Sold by
Baczynski Rose M
Bought by
Zito Christine R and Baczynski Kathleen T
Purchase Details
Closed on
Oct 18, 1984
Bought by
Baczynski Edward B Baczynski Trs
Create a Home Valuation Report for This Property
The Home Valuation Report is an in-depth analysis detailing your home's value as well as a comparison with similar homes in the area
Home Values in the Area
Average Home Value in this Area
Purchase History
| Date | Buyer | Sale Price | Title Company |
|---|---|---|---|
| Baczynski Kathleen Theresa | -- | None Listed On Document | |
| Zito Christine Rosemary | -- | None Available | |
| Baczynski Kathleen Theresa | -- | None Available | |
| Baczynski Kathleen Theresa | -- | None Available | |
| Zito Christine R | -- | None Available | |
| Baczynski Edward B Baczynski Trs | $55,000 | -- |
Source: Public Records
Tax History Compared to Growth
Tax History
| Year | Tax Paid | Tax Assessment Tax Assessment Total Assessment is a certain percentage of the fair market value that is determined by local assessors to be the total taxable value of land and additions on the property. | Land | Improvement |
|---|---|---|---|---|
| 2025 | $1,377 | $111,675 | $50,760 | $60,915 |
| 2024 | $1,377 | $109,486 | $49,765 | $59,721 |
| 2023 | $1,346 | $107,340 | $48,790 | $58,550 |
| 2022 | $1,310 | $105,236 | $47,834 | $57,402 |
| 2021 | $1,302 | $103,174 | $46,897 | $56,277 |
| 2020 | $1,286 | $102,117 | $46,417 | $55,700 |
| 2019 | $1,264 | $100,115 | $45,507 | $54,608 |
| 2018 | $1,183 | $98,153 | $44,615 | $53,538 |
| 2017 | $80 | $96,230 | $43,741 | $52,489 |
| 2016 | $1,136 | $94,344 | $42,884 | $51,460 |
| 2015 | $1,120 | $92,928 | $42,240 | $50,688 |
| 2014 | $1,103 | $91,109 | $41,413 | $49,696 |
Source: Public Records
About Pacific Plaza Terrace
Map
Nearby Homes
- 1643 Missouri St Unit U2
- 1713 Missouri St
- 1885 Diamond St Unit 133
- 1885 Diamond St Unit 2-235
- 1885 Diamond St Unit 2-234
- 1885 Diamond St Unit 310
- 1855 Diamond St Unit 201
- 1775 Diamond St Unit 220
- 1855 Diamond St Unit 5-309
- 1855 Diamond St Unit 228
- 1679-81 Chalcedony St
- 1828 Diamond St Unit 3
- 4600 Lamont St Unit 4-103
- 1434-44 Garnet Ave
- 1812 Grand Ave
- 1361 Felspar St Unit 7
- 1419 Hornblend St Unit 3
- 4804 Lamont St
- 1300 Grand Ave Unit 38, 39
- 1367 Hornblend St
- 1645 Emerald St Unit Pacific Beach
- 1645 Emerald St
- 1645 Emerald St Unit w1
- 1645 Emerald St Unit 2U
- 1645 Emerald St Unit 2T
- 1645 Emerald St Unit 2S
- 1645 Emerald St Unit 2R
- 1645 Emerald St Unit 2P
- 1645 Emerald St Unit 2O
- 1645 Emerald St Unit 2N
- 1645 Emerald St Unit 2M
- 1645 Emerald St Unit 2L
- 1645 Emerald St Unit 2K
- 1645 Emerald St Unit 2J
- 1645 Emerald St Unit 2I
- 1645 Emerald St Unit 2H
- 1645 Emerald St Unit 2G
- 1645 Emerald St Unit 2F
- 1645 Emerald St Unit 2E
- 1645 Emerald St Unit 2C