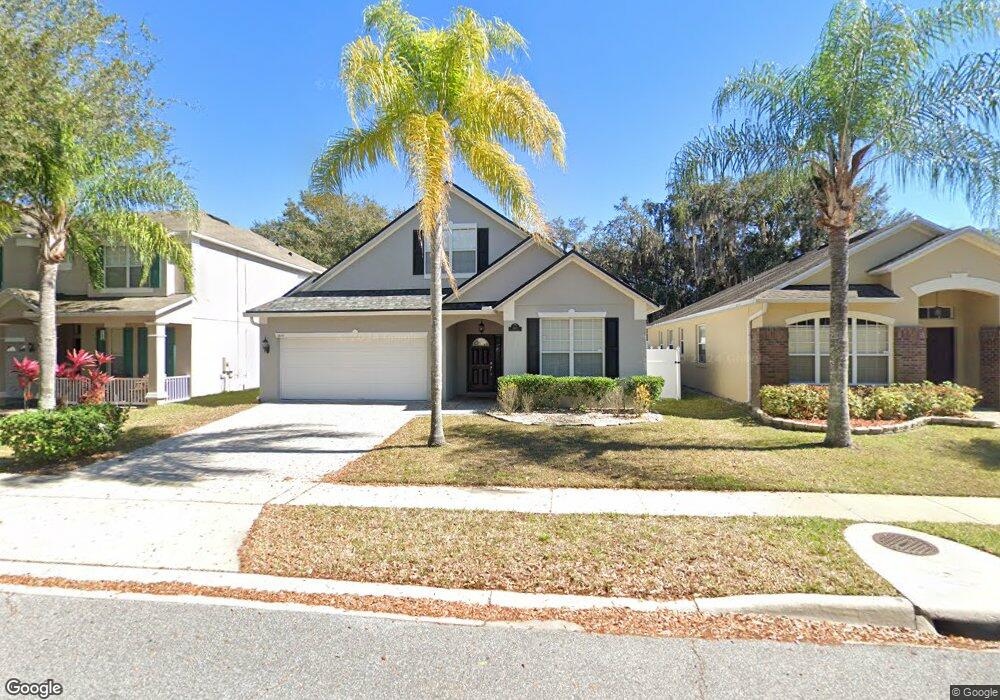
1645 Lalique Ln Orlando, FL 32828
Waterford Lakes NeighborhoodEstimated Value: $461,000 - $480,000
3
Beds
2
Baths
2,963
Sq Ft
$159/Sq Ft
Est. Value
About This Home
This home is located at 1645 Lalique Ln, Orlando, FL 32828 and is currently estimated at $471,447, approximately $159 per square foot. 1645 Lalique Ln is a home located in Orange County with nearby schools including Castle Creek Elementary School, Timber Springs Middle School, and East River High School.
Ownership History
Date
Name
Owned For
Owner Type
Purchase Details
Closed on
Sep 22, 2015
Sold by
Doner Dror Dayan
Bought by
Doner Annette
Current Estimated Value
Purchase Details
Closed on
Oct 11, 2013
Sold by
Doner Annette
Bought by
Doner Dror Dayan
Purchase Details
Closed on
Apr 22, 2005
Sold by
Dagan Annette
Bought by
Dagan Annette and Doner Dror
Home Financials for this Owner
Home Financials are based on the most recent Mortgage that was taken out on this home.
Original Mortgage
$233,708
Outstanding Balance
$115,647
Interest Rate
5.25%
Mortgage Type
Purchase Money Mortgage
Estimated Equity
$355,800
Purchase Details
Closed on
Feb 24, 2005
Sold by
Cambridge Homes Lllp
Bought by
Dagan Annette
Home Financials for this Owner
Home Financials are based on the most recent Mortgage that was taken out on this home.
Original Mortgage
$233,708
Outstanding Balance
$115,647
Interest Rate
5.25%
Mortgage Type
Purchase Money Mortgage
Estimated Equity
$355,800
Create a Home Valuation Report for This Property
The Home Valuation Report is an in-depth analysis detailing your home's value as well as a comparison with similar homes in the area
Home Values in the Area
Average Home Value in this Area
Purchase History
| Date | Buyer | Sale Price | Title Company |
|---|---|---|---|
| Doner Annette | -- | None Available | |
| Doner Dror Dayan | -- | None Available | |
| Dagan Annette | -- | -- | |
| Dagan Annette | $292,200 | Fidelity National Title Ins |
Source: Public Records
Mortgage History
| Date | Status | Borrower | Loan Amount |
|---|---|---|---|
| Open | Dagan Annette | $233,708 | |
| Closed | Dagan Annette | $29,213 |
Source: Public Records
Tax History Compared to Growth
Tax History
| Year | Tax Paid | Tax Assessment Tax Assessment Total Assessment is a certain percentage of the fair market value that is determined by local assessors to be the total taxable value of land and additions on the property. | Land | Improvement |
|---|---|---|---|---|
| 2025 | $3,567 | $244,601 | -- | -- |
| 2024 | $3,317 | $237,707 | -- | -- |
| 2023 | $3,317 | $224,280 | $0 | $0 |
| 2022 | $3,181 | $217,748 | $0 | $0 |
| 2021 | $3,147 | $211,406 | $0 | $0 |
| 2020 | $2,994 | $208,487 | $0 | $0 |
| 2019 | $3,076 | $203,800 | $0 | $0 |
| 2018 | $3,050 | $200,000 | $0 | $0 |
| 2017 | $2,994 | $223,414 | $28,000 | $195,414 |
| 2016 | $2,964 | $215,384 | $25,000 | $190,384 |
| 2015 | $3,791 | $202,845 | $25,000 | $177,845 |
| 2014 | $3,606 | $189,490 | $38,000 | $151,490 |
Source: Public Records
Map
Nearby Homes
- 1350 Sherman St
- 15265 Old Cheney Hwy
- 1591 Semon Dr Unit 10
- 1581 Semon Dr Unit 11
- 1571 Semon Dr Unit 12
- 1531 Semon Dr Unit 16
- 1651 Semon Dr Unit 4
- 1681 Semon Dr Unit 1
- 1620 Genie St Unit 25
- 1670 Genie St Unit 30
- 1599 Genie St Unit 40
- 1295 Sherman St
- 1679 Genie St Unit 32
- 14900 Spyglass St Unit 66
- 1444 Bella Coola Dr
- 14901 Spyglass St Unit 107
- 1224 Blackwater Pond Dr
- 14264 Acorn Ridge Dr
- 14945 Firestone St
- 14750 Firestone St Unit 335
- 1707 Lalique Ln
- 1639 Lalique Ln
- 1713 Lalique Ln
- 1633 Lalique Ln
- 1719 Lalique Ln
- 1627 Lalique Ln
- 1644 Lalique Ln
- 1638 Lalique Ln
- 1706 Lalique Ln
- 1632 Lalique Ln
- 1712 Lalique Ln
- 1725 Lalique Ln
- 1621 Lalique Ln
- 1626 Lalique Ln
- 1731 Lalique Ln
- 1615 Lalique Ln
- 1518 Lalique Ln
- 1524 Lalique Ln
- 1512 Lalique Ln
- 1506 Lalique Ln