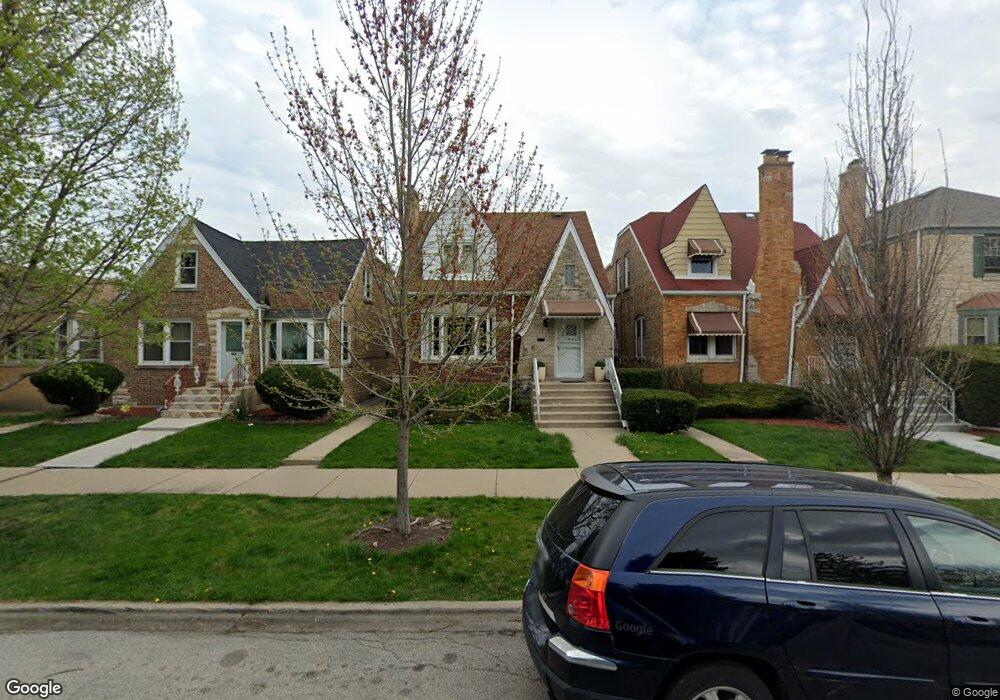
1645 N Rutherford Ave Chicago, IL 60707
Galewood NeighborhoodEstimated Value: $358,000 - $402,000
3
Beds
2
Baths
1,237
Sq Ft
$309/Sq Ft
Est. Value
About This Home
This home is located at 1645 N Rutherford Ave, Chicago, IL 60707 and is currently estimated at $382,482, approximately $309 per square foot. 1645 N Rutherford Ave is a home located in Cook County with nearby schools including Sayre Elementary Language Academy, Steinmetz College Prep, and Acero - Roberto Clemente Elementary School.
Ownership History
Date
Name
Owned For
Owner Type
Purchase Details
Closed on
Apr 7, 2022
Sold by
Harmon Lawrence and Harmon Juanita L
Bought by
Gant Daniel Q
Current Estimated Value
Home Financials for this Owner
Home Financials are based on the most recent Mortgage that was taken out on this home.
Original Mortgage
$240,000
Outstanding Balance
$224,313
Interest Rate
3.95%
Mortgage Type
New Conventional
Estimated Equity
$158,169
Purchase Details
Closed on
Mar 21, 2022
Sold by
Harmon Lawrence and Harmon Juanita L
Bought by
Gant Daniel Q
Home Financials for this Owner
Home Financials are based on the most recent Mortgage that was taken out on this home.
Original Mortgage
$240,000
Outstanding Balance
$224,313
Interest Rate
3.95%
Mortgage Type
New Conventional
Estimated Equity
$158,169
Create a Home Valuation Report for This Property
The Home Valuation Report is an in-depth analysis detailing your home's value as well as a comparison with similar homes in the area
Home Values in the Area
Average Home Value in this Area
Purchase History
| Date | Buyer | Sale Price | Title Company |
|---|---|---|---|
| Gant Daniel Q | $300,000 | -- | |
| Gant Daniel Q | $300,000 | Premier Title Company |
Source: Public Records
Mortgage History
| Date | Status | Borrower | Loan Amount |
|---|---|---|---|
| Open | Gant Daniel Q | $240,000 |
Source: Public Records
Tax History Compared to Growth
Tax History
| Year | Tax Paid | Tax Assessment Tax Assessment Total Assessment is a certain percentage of the fair market value that is determined by local assessors to be the total taxable value of land and additions on the property. | Land | Improvement |
|---|---|---|---|---|
| 2024 | $5,422 | $32,000 | $11,718 | $20,282 |
| 2023 | $4,701 | $29,000 | $9,450 | $19,550 |
| 2022 | $4,701 | $29,000 | $9,450 | $19,550 |
| 2021 | $3,099 | $29,000 | $9,450 | $19,550 |
| 2020 | $3,198 | $21,094 | $4,725 | $16,369 |
| 2019 | $3,188 | $23,702 | $4,725 | $18,977 |
| 2018 | $3,140 | $23,702 | $4,725 | $18,977 |
| 2017 | $3,362 | $24,359 | $4,158 | $20,201 |
| 2016 | $4,024 | $24,359 | $4,158 | $20,201 |
| 2015 | $3,642 | $24,359 | $4,158 | $20,201 |
| 2014 | $4,004 | $24,135 | $3,780 | $20,355 |
| 2013 | $3,914 | $24,135 | $3,780 | $20,355 |
Source: Public Records
Map
Nearby Homes
- 1639 N Normandy Ave
- 1700 N Natoma Ave
- 1733 N Oak Park Ave
- 1227 N East Ave
- 1600 N New England Ave Unit 4
- 1701 N Newland Ave
- 1130 N Grove Ave
- 1916 N Rutherford Ave
- 1937 N Normandy Ave
- 1104 Fair Oaks Ave
- 1143 Woodbine Ave
- 1941 N New England Ave
- 1221 Edmer Ave
- 1627 N Narragansett Ave
- 1009 N Oak Park Ave
- 925 Linden Ave
- 438 Lenox St
- 1905 N Nordica Ave
- 1122 N Ridgeland Ave
- 1212 N Harvey Ave
- 1649 N Rutherford Ave
- 1643 N Rutherford Ave
- 1651 N Rutherford Ave
- 1639 N Rutherford Ave
- 1637 N Rutherford Ave
- 1655 N Rutherford Ave
- 1633 N Rutherford Ave
- 1644 N Normandy Ave
- 1642 N Normandy Ave
- 1648 N Normandy Ave
- 1631 N Rutherford Ave
- 1638 N Normandy Ave
- 1652 N Normandy Ave
- 1636 N Normandy Ave
- 1627 N Rutherford Ave
- 1632 N Normandy Ave
- 1644 N Rutherford Ave
- 1642 N Rutherford Ave
- 1648 N Rutherford Ave
- 1638 N Rutherford Ave