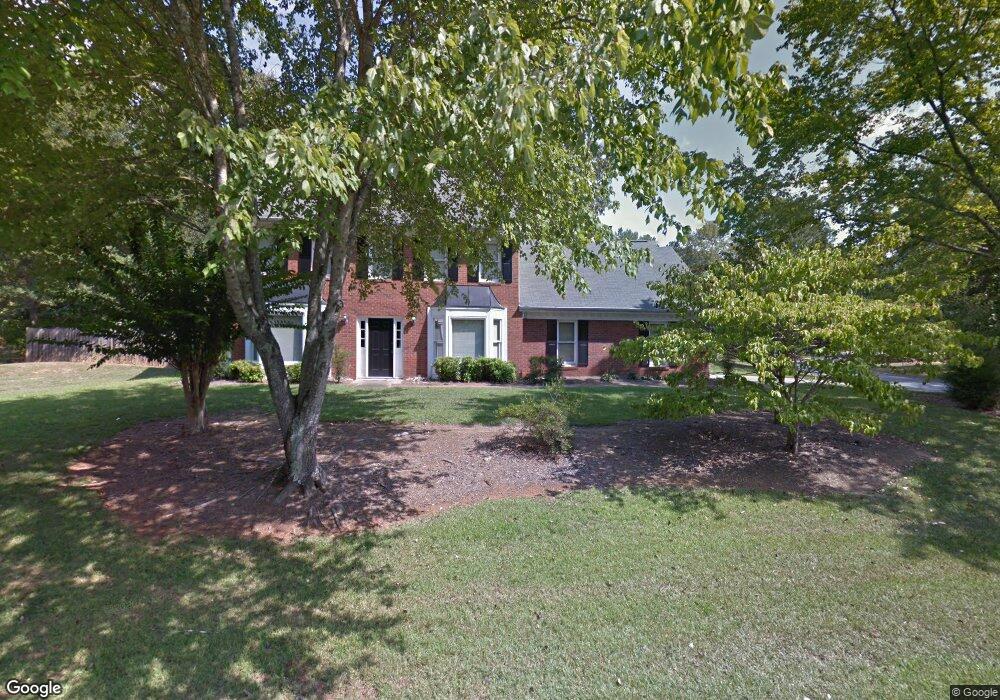
1645 Pinefield Rd Marietta, GA 30066
Sandy Plains NeighborhoodEstimated Value: $470,000 - $554,000
4
Beds
3
Baths
2,706
Sq Ft
$187/Sq Ft
Est. Value
About This Home
This home is located at 1645 Pinefield Rd, Marietta, GA 30066 and is currently estimated at $505,870, approximately $186 per square foot. 1645 Pinefield Rd is a home located in Cobb County with nearby schools including Keheley Elementary School, McCleskey Middle School, and The Garden School.
Ownership History
Date
Name
Owned For
Owner Type
Purchase Details
Closed on
Apr 25, 2022
Sold by
James Charles A
Bought by
James Charles A and Cale Elizabeth Anne
Current Estimated Value
Purchase Details
Closed on
Nov 14, 2014
Sold by
James Sue S
Bought by
James Charles A
Purchase Details
Closed on
Feb 26, 1998
Sold by
Gerard Guy R and Gerard Laura C
Bought by
Dalton Richard M and Dalton Sheila
Home Financials for this Owner
Home Financials are based on the most recent Mortgage that was taken out on this home.
Original Mortgage
$136,000
Interest Rate
6.95%
Mortgage Type
New Conventional
Purchase Details
Closed on
Jul 27, 1994
Sold by
Moore Charles M Catherin
Bought by
James Charles A Sue S
Home Financials for this Owner
Home Financials are based on the most recent Mortgage that was taken out on this home.
Original Mortgage
$134,800
Interest Rate
8.56%
Create a Home Valuation Report for This Property
The Home Valuation Report is an in-depth analysis detailing your home's value as well as a comparison with similar homes in the area
Home Values in the Area
Average Home Value in this Area
Purchase History
| Date | Buyer | Sale Price | Title Company |
|---|---|---|---|
| James Charles A | -- | None Listed On Document | |
| James Charles A | -- | -- | |
| Dalton Richard M | $84,900 | -- | |
| James Charles A Sue S | $141,000 | -- |
Source: Public Records
Mortgage History
| Date | Status | Borrower | Loan Amount |
|---|---|---|---|
| Previous Owner | Dalton Richard M | $136,000 | |
| Previous Owner | James Charles A Sue S | $134,800 |
Source: Public Records
Tax History Compared to Growth
Tax History
| Year | Tax Paid | Tax Assessment Tax Assessment Total Assessment is a certain percentage of the fair market value that is determined by local assessors to be the total taxable value of land and additions on the property. | Land | Improvement |
|---|---|---|---|---|
| 2025 | $873 | $174,568 | $36,000 | $138,568 |
| 2024 | $876 | $174,568 | $36,000 | $138,568 |
| 2023 | $682 | $174,568 | $36,000 | $138,568 |
| 2022 | $699 | $111,368 | $28,000 | $83,368 |
| 2021 | $699 | $111,368 | $28,000 | $83,368 |
| 2020 | $695 | $109,820 | $24,000 | $85,820 |
| 2019 | $695 | $109,820 | $24,000 | $85,820 |
| 2018 | $634 | $89,604 | $24,000 | $65,604 |
| 2017 | $2,074 | $89,604 | $24,000 | $65,604 |
| 2016 | $1,872 | $80,236 | $24,000 | $56,236 |
| 2015 | $1,849 | $77,428 | $24,000 | $53,428 |
| 2014 | $1,861 | $77,428 | $0 | $0 |
Source: Public Records
Map
Nearby Homes
- 4941 Willow Ln
- 156 W Oaks Place
- 5009 Kingsley Manor Ct
- 4924 Locklear Way
- 2899 Treeside Terrace
- 1877 Falcon Wood Dr NE
- 4791 Jamerson Forest Cir
- 226 Hames Rd Unit 405
- 226 Hames Rd Unit 225
- 1513 Jamerson Landing
- 4782 Jamerson Creek Ct
- 4813 Highpoint Dr NE
- 4865 Chapelle Ct
- 4680 Jamerson Forest Pkwy
- 1244 Hickory Wood Dr NE
- 4758 Jamerson Forest Cir
- 1647 Pinefield Rd Unit 2
- 4910 Willow Creek Dr
- 4899 Willow Creek Dr
- 4903 Willow Creek Dr
- 4914 Willow Creek Dr Unit 2
- 1649 Pinefield Rd
- 1644 Pinefield Rd
- 1644 Pinefield Rd Unit II
- 1648 Pinefield Rd Unit 2
- 4895 Willow Creek Dr
- 4907 Willow Creek Dr
- 4911 Willow Creek Dr Unit 2
- 1650 Pineridge Ct
- 1651 Pinefield Rd Unit 2
- 1650 Pinefield Rd
- 4891 Willow Creek Dr
- 4898 Willow Creek Dr Unit II
- 1660 Pineridge Ct
- 1610 Pinefield Cir
- 1610 Pinefield Cir Unit 39