1645 S 113th Plaza Omaha, NE 68144
Brook Hollow NeighborhoodEstimated Value: $342,323 - $410,000
2
Beds
2
Baths
2,282
Sq Ft
$170/Sq Ft
Est. Value
About This Home
This home is located at 1645 S 113th Plaza, Omaha, NE 68144 and is currently estimated at $389,081, approximately $170 per square foot. 1645 S 113th Plaza is a home located in Douglas County with nearby schools including Crestridge Magnet School, Beveridge Magnet Middle School, and Burke High School.
Ownership History
Date
Name
Owned For
Owner Type
Purchase Details
Closed on
Feb 2, 2024
Sold by
Brook Hollow Association Inc
Bought by
Brook Hollow Condominium Property Regime
Current Estimated Value
Purchase Details
Closed on
Oct 31, 2008
Sold by
Heming Elizabeth D Rev Tr
Bought by
Conway Mary C
Purchase Details
Closed on
Nov 20, 2001
Sold by
Fleming Elizabeth D
Bought by
Fleming Elizabeth D
Purchase Details
Closed on
Nov 12, 2001
Sold by
Fleming John F
Bought by
Fleming Elizabeth D
Create a Home Valuation Report for This Property
The Home Valuation Report is an in-depth analysis detailing your home's value as well as a comparison with similar homes in the area
Home Values in the Area
Average Home Value in this Area
Purchase History
| Date | Buyer | Sale Price | Title Company |
|---|---|---|---|
| Brook Hollow Condominium Property Regime | -- | None Listed On Document | |
| Conway Mary C | $200,000 | -- | |
| Fleming Elizabeth D | -- | -- | |
| Fleming Elizabeth D | -- | -- |
Source: Public Records
Tax History Compared to Growth
Tax History
| Year | Tax Paid | Tax Assessment Tax Assessment Total Assessment is a certain percentage of the fair market value that is determined by local assessors to be the total taxable value of land and additions on the property. | Land | Improvement |
|---|---|---|---|---|
| 2024 | $1,095 | $296,700 | $49,500 | $247,200 |
| 2023 | $1,095 | $265,800 | $49,500 | $216,300 |
| 2022 | $4,164 | $265,800 | $49,500 | $216,300 |
| 2021 | $2,389 | $220,300 | $49,500 | $170,800 |
| 2020 | $4,716 | $220,300 | $49,500 | $170,800 |
| 2019 | $4,730 | $220,300 | $49,500 | $170,800 |
| 2018 | $4,737 | $220,300 | $49,500 | $170,800 |
| 2017 | $4,760 | $220,300 | $49,500 | $170,800 |
| 2016 | $4,877 | $227,300 | $53,000 | $174,300 |
| 2015 | $3,969 | $187,500 | $24,600 | $162,900 |
| 2014 | $3,969 | $187,500 | $24,600 | $162,900 |
Source: Public Records
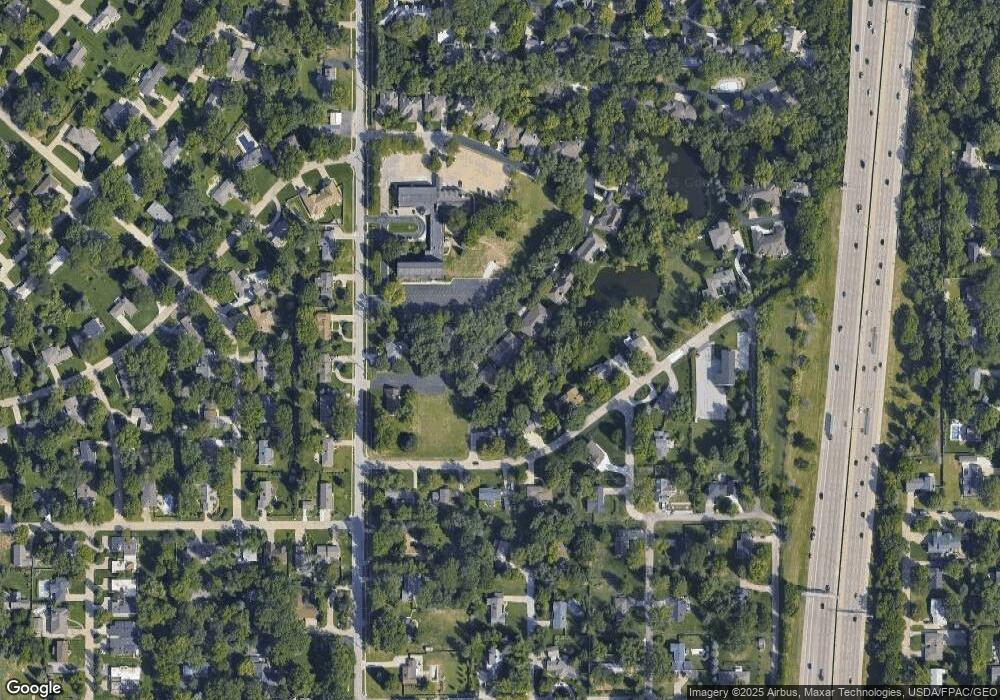
Map
Nearby Homes
- 11348 Pine St
- 11364 William Plaza
- 10922 Bel Air Dr
- 1108 S 113th Plaza
- 1705 S 116th St
- 1937 S 111th St
- 1216 S 108th St
- 1526 S 106th St
- 2425 S 113th St
- 10702 Martha St
- 11118 Leavenworth St
- 10615 Martha St
- 11811 Dorcas St
- 10913 Jones St
- 618 S 113th Ave
- 2312 S 119th Ct
- 1231 S 121st Plaza Unit 312
- 12106 Shirley St
- 10337 Pinehurst Ave
- 2817 S 116th Ave
- 1649 S 113th Plaza
- 1646 S 113th Plaza
- 1642 S 113th Plaza
- 1502 S 113th Plaza
- 1506 S 113th Plaza
- 1511 S 113th Plaza Unit 12
- 1601 S 113th Plaza
- 1611 S 113th Plaza
- 1615 S 113th Plaza
- 1621 S 113th Plaza Unit 6
- 1625 S 113th Plaza
- 1635 S 113th Plaza Unit 3
- 1641 S 113th Plaza
- 1511 S 113th Plaza
- 11209 Pine Plaza
- 11308 Pine Plaza Unit 32
- 11112 Pine Plaza
- 1631 S 113th Plaza
- 11306 Pine Plaza
- 11217 Woolworth Plaza