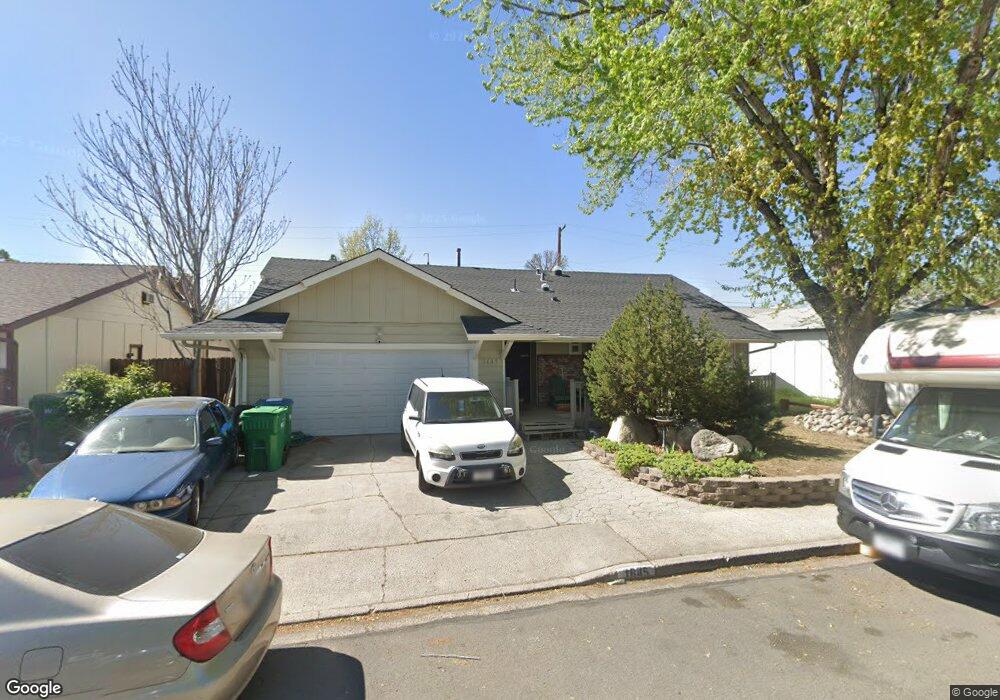
1645 Tyler Way Sparks, NV 89431
North Rock NeighborhoodEstimated Value: $391,159 - $432,000
3
Beds
2
Baths
1,301
Sq Ft
$312/Sq Ft
Est. Value
About This Home
This home is located at 1645 Tyler Way, Sparks, NV 89431 and is currently estimated at $406,540, approximately $312 per square foot. 1645 Tyler Way is a home located in Washoe County with nearby schools including Agnes Risley Elementary School, Sparks Middle School, and Sparks High School.
Ownership History
Date
Name
Owned For
Owner Type
Purchase Details
Closed on
Sep 22, 2003
Sold by
Peduzi Lisa D
Bought by
Katsilometes Alex
Current Estimated Value
Home Financials for this Owner
Home Financials are based on the most recent Mortgage that was taken out on this home.
Original Mortgage
$137,709
Outstanding Balance
$64,585
Interest Rate
6.4%
Mortgage Type
VA
Estimated Equity
$341,955
Purchase Details
Closed on
Feb 29, 1996
Sold by
Nepper Paul John and Nepper Cheri M
Bought by
Peduzi Katherine M and Peduzi Lisa D
Home Financials for this Owner
Home Financials are based on the most recent Mortgage that was taken out on this home.
Original Mortgage
$118,507
Interest Rate
7.04%
Mortgage Type
FHA
Purchase Details
Closed on
Jun 15, 1994
Sold by
Nepper Paul John
Bought by
Nepper Paul John and Nepper Cheri M
Create a Home Valuation Report for This Property
The Home Valuation Report is an in-depth analysis detailing your home's value as well as a comparison with similar homes in the area
Home Values in the Area
Average Home Value in this Area
Purchase History
| Date | Buyer | Sale Price | Title Company |
|---|---|---|---|
| Katsilometes Alex | $377,200 | First American Title | |
| Peduzi Katherine M | $122,000 | -- | |
| Nepper Paul John | -- | First Commercial Title Inc |
Source: Public Records
Mortgage History
| Date | Status | Borrower | Loan Amount |
|---|---|---|---|
| Open | Katsilometes Alex | $137,709 | |
| Previous Owner | Peduzi Katherine M | $118,507 |
Source: Public Records
Tax History Compared to Growth
Tax History
| Year | Tax Paid | Tax Assessment Tax Assessment Total Assessment is a certain percentage of the fair market value that is determined by local assessors to be the total taxable value of land and additions on the property. | Land | Improvement |
|---|---|---|---|---|
| 2025 | $867 | $57,821 | $34,825 | $22,996 |
| 2024 | $867 | $51,984 | $30,205 | $21,779 |
| 2023 | $842 | $51,926 | $31,780 | $20,146 |
| 2022 | $819 | $43,556 | $27,160 | $16,396 |
| 2021 | $796 | $34,102 | $18,235 | $15,867 |
| 2020 | $773 | $33,573 | $17,850 | $15,723 |
| 2019 | $750 | $32,496 | $17,605 | $14,891 |
| 2018 | $728 | $26,656 | $12,355 | $14,301 |
| 2017 | $708 | $25,357 | $11,235 | $14,122 |
| 2016 | $688 | $23,885 | $9,765 | $14,120 |
| 2015 | $595 | $22,672 | $8,645 | $14,027 |
| 2014 | $576 | $19,646 | $6,335 | $13,311 |
| 2013 | -- | $17,768 | $4,900 | $12,868 |
Source: Public Records
Map
Nearby Homes
- 1780 Greenbrae Dr
- 1655 Byrd Dr
- 1799 Vance Way
- 2154 Oppio St
- 1855 Verano Dr
- 1365 Prospect Ave
- 1595 York Way
- 1841 Merchant St
- 1124 Sbragia Way
- 1889 Merchant St
- 1121 Greenbrae Dr
- 1560 Steven Ct Unit 2
- 1527 Steven Ct
- 1536 Irene Way
- 973 Damon Ln
- 1110 Xman Way
- 1345 Plymouth Way
- 1160 York Way
- 1756 I St
- 1003 Sbragia Way
- 1655 Tyler Way
- 1675 Tyler Way
- 1650 Trabert Way
- 1610 Trabert Way
- 1601 Tyler Way
- 1622 Tyler Way Unit 1
- 1648 Tyler Way
- 1670 Trabert Way
- 1616 Tyler Way
- 1664 Tyler Way
- 1695 Tyler Way
- 1690 Trabert Way
- 1680 Tyler Way
- 1600 Tyler Way
- 1645 Byrd Dr
- 1615 Trabert Way
- 1625 Byrd Dr
- 1698 Tyler Way
- 1645 Trabert Way
- 1820 16th St