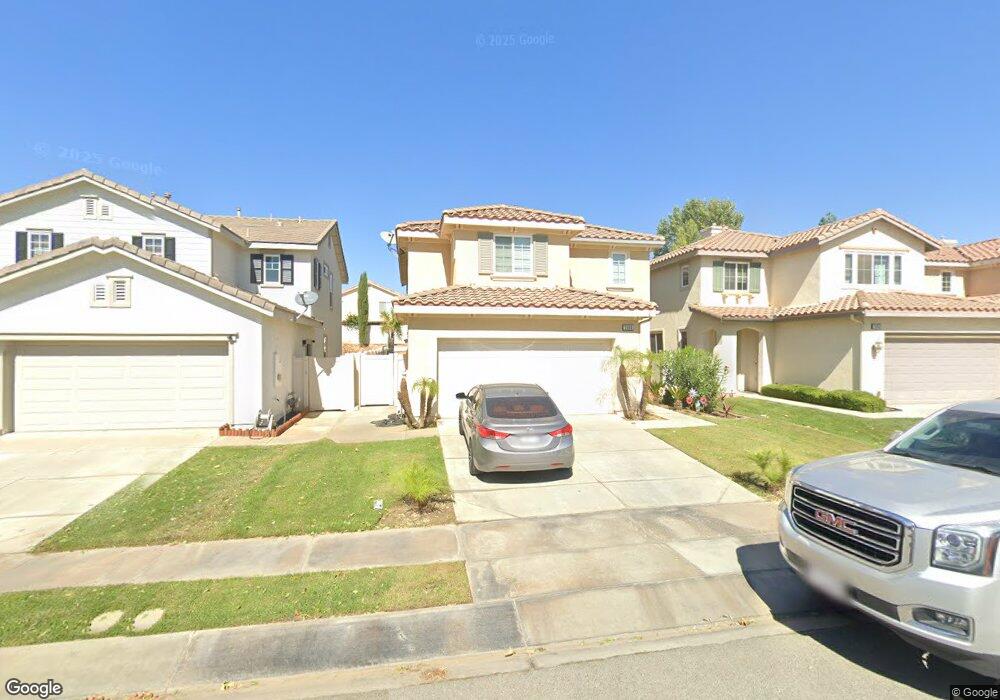
1646 Apollo Way Beaumont, CA 92223
Estimated Value: $451,000 - $523,000
4
Beds
3
Baths
2,141
Sq Ft
$234/Sq Ft
Est. Value
About This Home
This home is located at 1646 Apollo Way, Beaumont, CA 92223 and is currently estimated at $499,957, approximately $233 per square foot. 1646 Apollo Way is a home located in Riverside County with nearby schools including Sundance Elementary School, San Gorgonio Middle School, and Beaumont Senior High School.
Ownership History
Date
Name
Owned For
Owner Type
Purchase Details
Closed on
Jan 7, 2026
Sold by
Uribe Fidencia and Family Trust Of Fidencia Uribe
Bought by
Fidencia Uribe Living Trust and Uribe
Current Estimated Value
Purchase Details
Closed on
Dec 13, 2020
Sold by
Uribe Fidencia
Bought by
Uribe Fidencia and The Family Trust Of Fidencia U
Purchase Details
Closed on
Sep 7, 2019
Sold by
Uribe Lgnacio and Uribe Fidencia
Bought by
Uribe Fidencia
Purchase Details
Closed on
Apr 20, 2009
Sold by
Gonzalez Everardo and Lopez Karina
Bought by
Uribe Ignacio and Uribe Fidencia
Home Financials for this Owner
Home Financials are based on the most recent Mortgage that was taken out on this home.
Original Mortgage
$145,502
Interest Rate
5.31%
Mortgage Type
FHA
Purchase Details
Closed on
May 15, 2006
Sold by
Pardee Homes
Bought by
Gonzalez Everardo and Lopez Karina
Home Financials for this Owner
Home Financials are based on the most recent Mortgage that was taken out on this home.
Original Mortgage
$273,780
Interest Rate
7.4%
Mortgage Type
Fannie Mae Freddie Mac
Create a Home Valuation Report for This Property
The Home Valuation Report is an in-depth analysis detailing your home's value as well as a comparison with similar homes in the area
Home Values in the Area
Average Home Value in this Area
Purchase History
| Date | Buyer | Sale Price | Title Company |
|---|---|---|---|
| Fidencia Uribe Living Trust | -- | None Listed On Document | |
| Uribe Fidencia | -- | None Available | |
| Uribe Fidencia | -- | None Available | |
| Uribe Fidencia | -- | Lawyers Title | |
| Uribe Ignacio | $185,000 | Lawyers Title Company | |
| Gonzalez Everardo | $342,500 | Chicago Title Company |
Source: Public Records
Mortgage History
| Date | Status | Borrower | Loan Amount |
|---|---|---|---|
| Previous Owner | Uribe Ignacio | $145,502 | |
| Previous Owner | Gonzalez Everardo | $273,780 |
Source: Public Records
Tax History
| Year | Tax Paid | Tax Assessment Tax Assessment Total Assessment is a certain percentage of the fair market value that is determined by local assessors to be the total taxable value of land and additions on the property. | Land | Improvement |
|---|---|---|---|---|
| 2025 | $5,129 | $238,784 | $58,077 | $180,707 |
| 2023 | $5,129 | $229,514 | $55,823 | $173,691 |
| 2022 | $5,027 | $225,015 | $54,729 | $170,286 |
| 2021 | $4,971 | $220,604 | $53,656 | $166,948 |
| 2020 | $4,930 | $218,343 | $53,106 | $165,237 |
| 2019 | $4,869 | $214,063 | $52,065 | $161,998 |
| 2018 | $4,875 | $209,867 | $51,046 | $158,821 |
| 2017 | $5,023 | $205,753 | $50,046 | $155,707 |
| 2016 | $6,181 | $201,719 | $49,065 | $152,654 |
| 2015 | $5,911 | $198,691 | $48,329 | $150,362 |
| 2014 | $5,699 | $194,000 | $47,000 | $147,000 |
Source: Public Records
Map
Nearby Homes
- 1645 Rigel St
- 1639 Rigel St
- 1067 Gold Finch Place
- 1315 Redbud Ave
- 6291 Botanic Rd
- 6236 Harmony Way
- 1625 Moss Rose Way
- 1070 Waterleaf Ct
- 770 Allegheny St
- 1218 N Larkspur Ln
- 5183 Beech Ln
- 703 Allegheny St Unit 1-40
- 1640 Amber Lily Dr
- 5917 Verde Way
- 1334 Clover Way
- 925 Bluebell Way
- 1280 Smoke Tree Ln
- 1525 Horizon Ave
- 5762 Verde Way
- 1338 Smoke Tree Ln
- 1652 Apollo Way
- 1640 Apollo Way
- 1656 Apollo Way
- 1638 Apollo Way
- 1660 Apollo Way
- 1634 Apollo Way
- 1653 Rigel St
- 1649 Rigel St
- 1657 Rigel St
- 1661 Rigel St
- 1664 Apollo Way
- 1632 Apollo Way
- 1641 Apollo Way
- 1643 Rigel St
- 1647 Apollo Way
- 1639 Apollo Way
- 1653 Apollo Way
- 1665 Rigel St
- 1635 Apollo Way
- 1657 Apollo Way
Your Personal Tour Guide
Ask me questions while you tour the home.