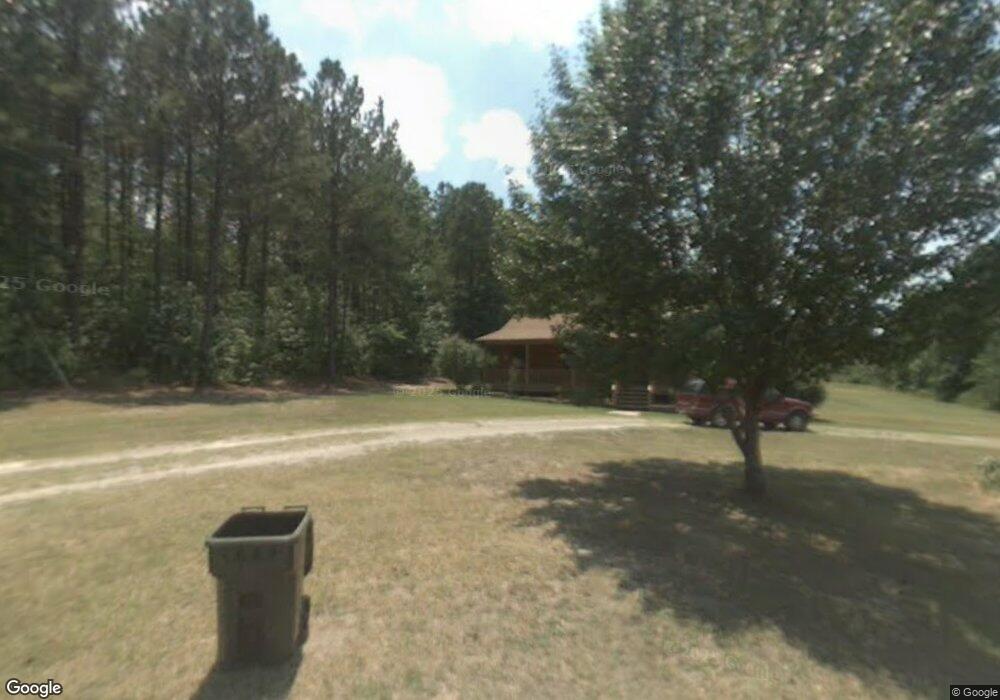
1646 Butterfly Ln Statham, GA 30666
Estimated Value: $211,323 - $337,000
3
Beds
3
Baths
1,960
Sq Ft
$142/Sq Ft
Est. Value
About This Home
This home is located at 1646 Butterfly Ln, Statham, GA 30666 and is currently estimated at $277,581, approximately $141 per square foot. 1646 Butterfly Ln is a home located in Barrow County with nearby schools including Statham Elementary School, Bear Creek Middle School, and Winder-Barrow High School.
Ownership History
Date
Name
Owned For
Owner Type
Purchase Details
Closed on
Jun 24, 2022
Sold by
Shelnutt James D
Bought by
Strickland Nathan and Strickland Michelle
Current Estimated Value
Purchase Details
Closed on
Jun 11, 2008
Sold by
Federal Home Loan Mortgage Corporation
Bought by
Shelnutt James D
Home Financials for this Owner
Home Financials are based on the most recent Mortgage that was taken out on this home.
Original Mortgage
$66,615
Interest Rate
6.27%
Purchase Details
Closed on
Dec 4, 2007
Sold by
Harris Laverne And
Bought by
Chase Home Finance Llc
Purchase Details
Closed on
Apr 16, 2001
Sold by
Harris Laverne
Bought by
Harris Laverne And
Home Financials for this Owner
Home Financials are based on the most recent Mortgage that was taken out on this home.
Original Mortgage
$72,500
Interest Rate
6.98%
Mortgage Type
New Conventional
Purchase Details
Closed on
Jul 1, 1986
Bought by
Harris Laverne
Create a Home Valuation Report for This Property
The Home Valuation Report is an in-depth analysis detailing your home's value as well as a comparison with similar homes in the area
Home Values in the Area
Average Home Value in this Area
Purchase History
| Date | Buyer | Sale Price | Title Company |
|---|---|---|---|
| Strickland Nathan | $200,000 | -- | |
| Shelnutt James D | -- | -- | |
| Chase Home Finance Llc | -- | -- | |
| Harris Laverne And | -- | -- | |
| Harris Laverne | -- | -- |
Source: Public Records
Mortgage History
| Date | Status | Borrower | Loan Amount |
|---|---|---|---|
| Previous Owner | Shelnutt James D | $66,615 | |
| Previous Owner | Harris Laverne And | $72,500 |
Source: Public Records
Tax History Compared to Growth
Tax History
| Year | Tax Paid | Tax Assessment Tax Assessment Total Assessment is a certain percentage of the fair market value that is determined by local assessors to be the total taxable value of land and additions on the property. | Land | Improvement |
|---|---|---|---|---|
| 2024 | $816 | $31,722 | $31,722 | $0 |
| 2023 | $811 | $31,722 | $31,722 | $0 |
| 2022 | $1,096 | $8,452 | $0 | $8,452 |
| 2021 | $867 | $8,452 | $0 | $8,452 |
| 2020 | $882 | $8,452 | $0 | $8,452 |
| 2019 | $896 | $8,452 | $0 | $8,452 |
| 2018 | $876 | $8,452 | $0 | $8,452 |
| 2017 | $271 | $9,297 | $0 | $9,297 |
| 2016 | $898 | $33,527 | $22,857 | $10,670 |
| 2015 | $928 | $34,372 | $22,857 | $11,515 |
| 2014 | $592 | $23,560 | $11,200 | $12,360 |
| 2013 | -- | $24,405 | $11,200 | $13,205 |
Source: Public Records
Map
Nearby Homes
- 364 Pleasant Hill Church Rd
- 410 Tori Dr
- 364 Pleasant Hill Church Rd SE
- 2070 Dooley Town Rd
- 1849 Dooley Town Rd
- 1610 Trey Ln
- 532 Hemlock Dr
- The Baxley Plan at Statham Place
- The Landon II Plan at Statham Place
- 1679 Atlanta Hwy SE
- 79 Lyles Corner
- 384 Sunset Dr
- 390 Sunset Dr
- 226 Baker St
- 43 Lyles Corner
- 26 Lyles Corner
- 576 Lillian Way
- 2141 Kirkland Dr
- 1816 Oak Spring St
- 1638 Butterfly Ln
- 1650 Butterfly Ln
- 0 Butterfly Ln
- 1636 Butterfly Ln
- 1634 Butterfly Ln
- 1621 Butterfly Ln
- 1651 Trey Ln
- 1653 Trey Ln
- 1620 Butterfly Ln
- 1647 Trey Ln
- 1657 Trey Ln
- 1655 Trey Ln
- 1733 Granite Ln
- 1649 Trey Ln
- 1645 Trey Ln
- 1608 Butterfly Ln
- 1644 Trey Ln
- 1659 Trey Ln
- 1643 Trey Ln
- 1729 Granite Ln Unit 2